
|
Rexel S.A. (RXL.PA) DCF Valuation |
Fully Editable: Tailor To Your Needs In Excel Or Sheets
Professional Design: Trusted, Industry-Standard Templates
Investor-Approved Valuation Models
MAC/PC Compatible, Fully Unlocked
No Expertise Is Needed; Easy To Follow
Rexel S.A. (RXL.PA) Bundle
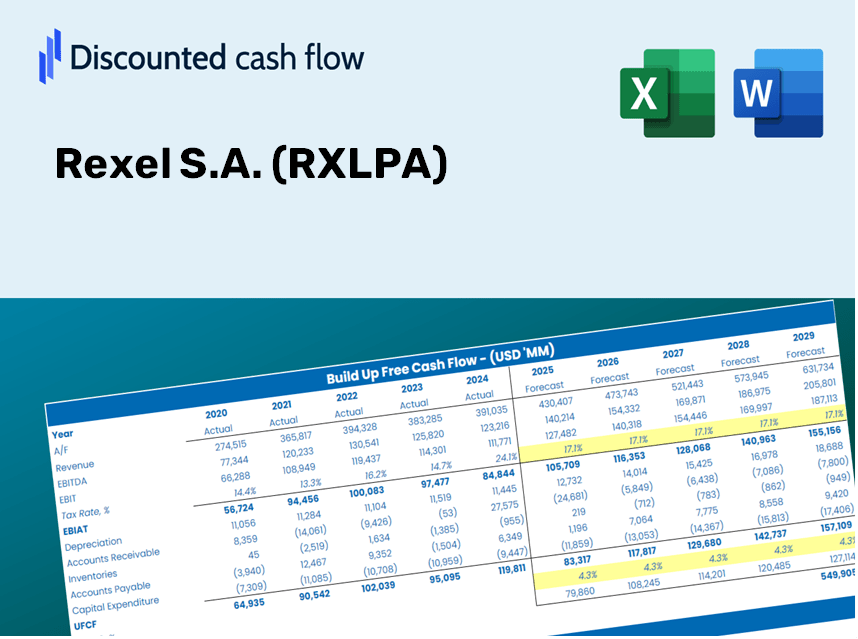
Gain insights into your Rexel S.A. (RXLPA) valuation analysis using our sophisticated DCF Calculator! Featuring up-to-date data for (RXLPA), this Excel template enables you to modify forecasts and assumptions to accurately determine the intrinsic value of Rexel S.A.
Discounted Cash Flow (DCF) - (USD MM)
| Year | AY1 2020 |
AY2 2021 |
AY3 2022 |
AY4 2023 |
AY5 2024 |
FY1 2025 |
FY2 2026 |
FY3 2027 |
FY4 2028 |
FY5 2029 |
|---|---|---|---|---|---|---|---|---|---|---|
| Revenue | 12,592.4 | 14,690.2 | 18,701.6 | 19,153.4 | 19,285.0 | 21,554.3 | 24,090.6 | 26,925.4 | 30,093.8 | 33,635.0 |
| Revenue Growth, % | 0 | 16.66 | 27.31 | 2.42 | 0.68708 | 11.77 | 11.77 | 11.77 | 11.77 | 11.77 |
| EBITDA | 796.7 | 1,187.7 | 1,695.3 | 1,601.0 | 1,323.7 | 1,668.3 | 1,864.6 | 2,084.0 | 2,329.2 | 2,603.3 |
| EBITDA, % | 6.33 | 8.08 | 9.06 | 8.36 | 6.86 | 7.74 | 7.74 | 7.74 | 7.74 | 7.74 |
| Depreciation | 294.4 | 308.0 | 349.8 | 371.4 | 490.5 | 465.0 | 519.8 | 580.9 | 649.3 | 725.7 |
| Depreciation, % | 2.34 | 2.1 | 1.87 | 1.94 | 2.54 | 2.16 | 2.16 | 2.16 | 2.16 | 2.16 |
| EBIT | 502.3 | 879.7 | 1,345.5 | 1,229.6 | 833.2 | 1,203.2 | 1,344.8 | 1,503.1 | 1,680.0 | 1,877.6 |
| EBIT, % | 3.99 | 5.99 | 7.19 | 6.42 | 4.32 | 5.58 | 5.58 | 5.58 | 5.58 | 5.58 |
| Total Cash | 685.4 | 573.5 | 895.4 | 912.7 | 883.3 | 1,012.2 | 1,131.3 | 1,264.4 | 1,413.2 | 1,579.5 |
| Total Cash, percent | .0 | .0 | .0 | .0 | .0 | .0 | .0 | .0 | .0 | .0 |
| Account Receivables | 2,292.9 | 2,849.3 | 3,288.4 | 2,623.8 | 3,489.9 | 3,749.7 | 4,191.0 | 4,684.1 | 5,235.3 | 5,851.4 |
| Account Receivables, % | 18.21 | 19.4 | 17.58 | 13.7 | 18.1 | 17.4 | 17.4 | 17.4 | 17.4 | 17.4 |
| Inventories | 1,511.1 | 2,057.2 | 2,275.4 | 2,386.4 | 2,485.7 | 2,738.2 | 3,060.5 | 3,420.6 | 3,823.1 | 4,273.0 |
| Inventories, % | 12 | 14 | 12.17 | 12.46 | 12.89 | 12.7 | 12.7 | 12.7 | 12.7 | 12.7 |
| Accounts Payable | 1,807.3 | 2,170.0 | 2,371.8 | 2,299.3 | 2,305.4 | 2,835.1 | 3,168.7 | 3,541.5 | 3,958.3 | 4,424.0 |
| Accounts Payable, % | 14.35 | 14.77 | 12.68 | 12 | 11.95 | 13.15 | 13.15 | 13.15 | 13.15 | 13.15 |
| Capital Expenditure | -109.6 | -109.3 | -131.4 | -158.2 | -132.1 | -165.0 | -184.4 | -206.1 | -230.4 | -257.5 |
| Capital Expenditure, % | -0.87037 | -0.74403 | -0.70261 | -0.82596 | -0.68499 | -0.76559 | -0.76559 | -0.76559 | -0.76559 | -0.76559 |
| Tax Rate, % | 46.87 | 46.87 | 46.87 | 46.87 | 46.87 | 46.87 | 46.87 | 46.87 | 46.87 | 46.87 |
| EBITAT | 1,088.3 | 674.9 | 1,014.3 | 908.2 | 442.7 | 912.3 | 1,019.6 | 1,139.6 | 1,273.7 | 1,423.6 |
| Depreciation | ||||||||||
| Changes in Account Receivables | ||||||||||
| Changes in Inventories | ||||||||||
| Changes in Accounts Payable | ||||||||||
| Capital Expenditure | ||||||||||
| UFCF | -723.6 | 133.8 | 777.2 | 1,602.5 | -158.2 | 1,229.6 | 925.1 | 1,034.0 | 1,155.6 | 1,291.6 |
| WACC, % | 7.57 | 7.19 | 7.16 | 7.14 | 6.8 | 7.17 | 7.17 | 7.17 | 7.17 | 7.17 |
| PV UFCF | ||||||||||
| SUM PV UFCF | 4,582.5 | |||||||||
| Long Term Growth Rate, % | 1.00 | |||||||||
| Free cash flow (T + 1) | 1,305 | |||||||||
| Terminal Value | 21,142 | |||||||||
| Present Terminal Value | 14,954 | |||||||||
| Enterprise Value | 19,537 | |||||||||
| Net Debt | 3,844 | |||||||||
| Equity Value | 15,693 | |||||||||
| Diluted Shares Outstanding, MM | 295 | |||||||||
| Equity Value Per Share | 53.13 |
What You Will Receive
- Authentic Rexel Data: Comprehensive financials – from revenue to EBIT – based on actual and forecasted figures for Rexel S.A. (RXLPA).
- Complete Customization: Modify essential parameters (highlighted cells) such as WACC, growth %, and tax rates to fit your analysis.
- Instant Valuation Refresh: Automatic updates to reassess the effect of adjustments on Rexel’s fair value.
- Flexible Excel Template: Designed for easy modifications, scenario analysis, and in-depth forecasting.
- Efficient and Precise: Avoid the hassle of building models from the ground up while ensuring accuracy and adaptability.
Key Features
- Real-Time RXLPA Data: Pre-loaded with Rexel S.A.'s historical financial performance and future projections.
- Fully Customizable Options: Modify inputs such as revenue growth, profit margins, discount rates, tax rates, and capital investments.
- Interactive Valuation Model: Automatic recalculations of Net Present Value (NPV) and intrinsic value based on your adjustments.
- Scenario Analysis: Develop various forecasting scenarios to explore different valuation possibilities.
- User-Centric Interface: Intuitive, well-organized, and suitable for both seasoned professionals and newcomers.
How It Works
- Step 1: Download the Excel spreadsheet.
- Step 2: Examine the pre-filled Rexel S.A. (RXLPA) data, both historical and projected.
- Step 3: Modify key assumptions (highlighted in yellow) according to your analysis.
- Step 4: Observe automatic recalculations of Rexel S.A.'s (RXLPA) intrinsic value.
- Step 5: Utilize the results for making investment decisions or for reporting purposes.
Why Opt for the Rexel S.A. (RXLPA) Calculator?
- Precision: Utilizes authentic Rexel financial data to guarantee accurate results.
- Versatility: Built to allow users the freedom to experiment and adjust inputs as needed.
- Efficiency: Bypass the complexities of creating a DCF model from the ground up.
- Top-Tier Quality: Crafted with the expertise and usability expected at the CFO level.
- User-Friendly: Simple interface suitable for individuals with varying levels of financial modeling knowledge.
Who Can Benefit from This Product?
- Investors: Precisely assess the fair value of Rexel S.A. (RXLPA) prior to making investment choices.
- CFOs: Utilize a professional-grade DCF model for accurate financial reporting and analysis.
- Consultants: Easily customize the template for valuation reports tailored to clients.
- Entrepreneurs: Acquire valuable insights into the financial modeling practices of industry leaders.
- Educators: Employ it as a teaching resource to illustrate various valuation methodologies.
Contents of the Template
- Preloaded RXLPA Data: Historical and projected financial metrics, including revenue, EBIT, and capital expenditures.
- DCF and WACC Models: Advanced spreadsheets for calculating intrinsic value and Weighted Average Cost of Capital.
- Editable Inputs: Yellow-highlighted fields for customizing revenue growth, tax rates, and discount rates.
- Financial Statements: Detailed annual and quarterly financial reports for in-depth analysis.
- Key Ratios: Metrics for profitability, leverage, and efficiency to assess performance.
- Dashboard and Charts: Visual representations of valuation results and underlying assumptions.
Disclaimer
All information, articles, and product details provided on this website are for general informational and educational purposes only. We do not claim any ownership over, nor do we intend to infringe upon, any trademarks, copyrights, logos, brand names, or other intellectual property mentioned or depicted on this site. Such intellectual property remains the property of its respective owners, and any references here are made solely for identification or informational purposes, without implying any affiliation, endorsement, or partnership.
We make no representations or warranties, express or implied, regarding the accuracy, completeness, or suitability of any content or products presented. Nothing on this website should be construed as legal, tax, investment, financial, medical, or other professional advice. In addition, no part of this site—including articles or product references—constitutes a solicitation, recommendation, endorsement, advertisement, or offer to buy or sell any securities, franchises, or other financial instruments, particularly in jurisdictions where such activity would be unlawful.
All content is of a general nature and may not address the specific circumstances of any individual or entity. It is not a substitute for professional advice or services. Any actions you take based on the information provided here are strictly at your own risk. You accept full responsibility for any decisions or outcomes arising from your use of this website and agree to release us from any liability in connection with your use of, or reliance upon, the content or products found herein.