
|
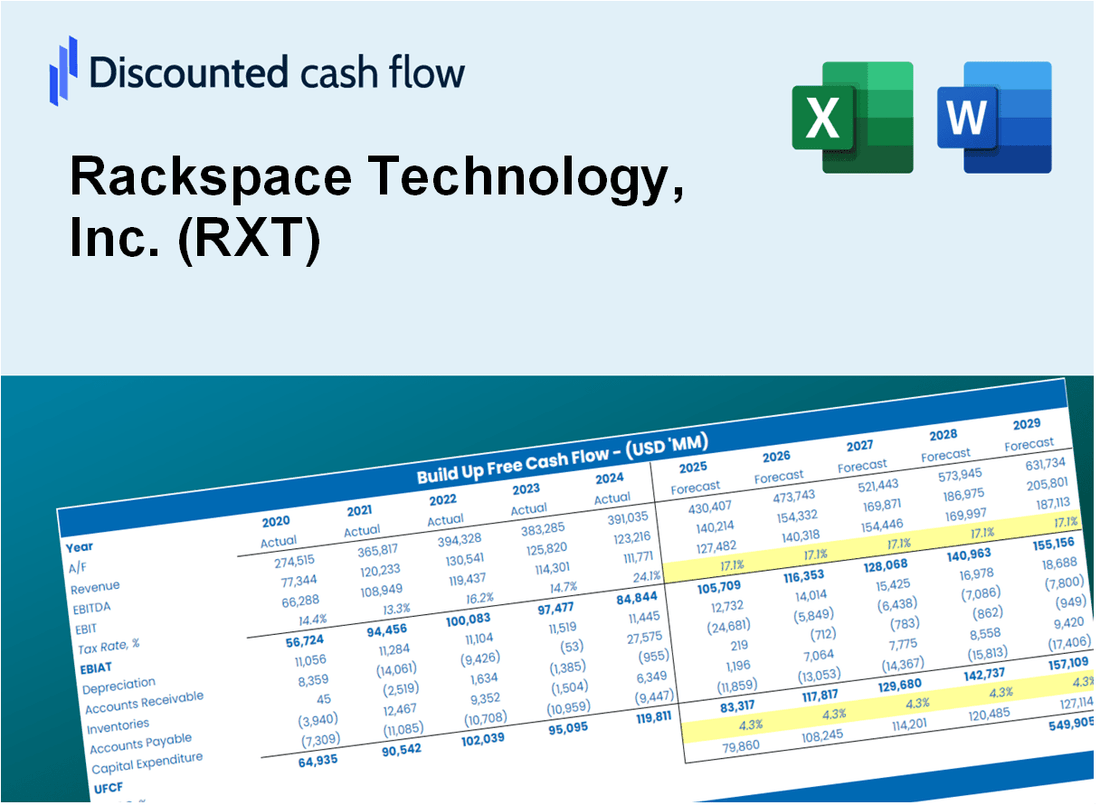
Rackspace Technology, Inc. (RXT) DCF Valuation |
Fully Editable: Tailor To Your Needs In Excel Or Sheets
Professional Design: Trusted, Industry-Standard Templates
Investor-Approved Valuation Models
MAC/PC Compatible, Fully Unlocked
No Expertise Is Needed; Easy To Follow
Rackspace Technology, Inc. (RXT) Bundle
Enhance your investment strategies with the Rackspace Technology, Inc. (RXT) DCF Calculator! Explore real financial data, adjust growth projections and expenses, and instantly observe how these changes affect the intrinsic value of Rackspace Technology, Inc. (RXT).
What You Will Get
- Real Rackspace Data: Preloaded financials – from revenue to EBIT – based on actual and projected figures.
- Full Customization: Adjust all critical parameters (yellow cells) like WACC, growth %, and tax rates.
- Instant Valuation Updates: Automatic recalculations to analyze the impact of changes on Rackspace's fair value.
- Versatile Excel Template: Tailored for quick edits, scenario testing, and detailed projections.
- Time-Saving and Accurate: Skip building models from scratch while maintaining precision and flexibility.
Key Features
- Comprehensive Rackspace Data: Access reliable pre-loaded historical performance metrics and future growth forecasts.
- Adjustable Financial Assumptions: Modify highlighted fields such as WACC, growth rates, and profit margins.
- Real-Time Analytics: Automatic recalculations for DCF, Net Present Value (NPV), and cash flow assessments.
- Interactive Visual Dashboard: User-friendly charts and summaries to help you interpret your valuation findings.
- Suitable for All Skill Levels: An intuitive design tailored for investors, CFOs, and consultants alike.
How It Works
- Download: Obtain the ready-to-use Excel file featuring Rackspace Technology, Inc.'s (RXT) financial data.
- Customize: Tailor forecasts, including revenue growth, EBITDA %, and WACC to your needs.
- Update Automatically: Watch as intrinsic value and NPV calculations refresh in real-time.
- Test Scenarios: Generate various projections and instantly compare results.
- Make Decisions: Leverage the valuation outcomes to shape your investment strategy.
Why Choose This Calculator for Rackspace Technology, Inc. (RXT)?
- Designed for Experts: A sophisticated tool tailored for IT professionals, analysts, and decision-makers.
- Accurate Data: Rackspace’s historical and projected financials preloaded for precision.
- Flexible Scenario Analysis: Easily test various forecasts and assumptions to see potential outcomes.
- Insightful Outputs: Automatically computes intrinsic value, NPV, and essential metrics.
- User-Friendly: Comprehensive step-by-step guidance simplifies the process.
Who Should Use This Product?
- Investors: Assess Rackspace Technology’s valuation before making investment decisions.
- CFOs and Financial Analysts: Optimize valuation methodologies and evaluate financial forecasts.
- Startup Founders: Understand the valuation strategies of established tech companies like Rackspace.
- Consultants: Provide expert valuation insights and reports for client projects.
- Students and Educators: Utilize current data to practice and teach valuation principles.
What the Template Contains
- Historical Data: Includes Rackspace Technology’s past financials and baseline forecasts.
- DCF and Levered DCF Models: Detailed templates to calculate Rackspace Technology’s intrinsic value.
- WACC Sheet: Pre-built calculations for Weighted Average Cost of Capital.
- Editable Inputs: Modify key drivers like growth rates, EBITDA %, and CAPEX assumptions.
- Quarterly and Annual Statements: A complete breakdown of Rackspace Technology’s financials.
- Interactive Dashboard: Visualize valuation results and projections dynamically.
Disclaimer
All information, articles, and product details provided on this website are for general informational and educational purposes only. We do not claim any ownership over, nor do we intend to infringe upon, any trademarks, copyrights, logos, brand names, or other intellectual property mentioned or depicted on this site. Such intellectual property remains the property of its respective owners, and any references here are made solely for identification or informational purposes, without implying any affiliation, endorsement, or partnership.
We make no representations or warranties, express or implied, regarding the accuracy, completeness, or suitability of any content or products presented. Nothing on this website should be construed as legal, tax, investment, financial, medical, or other professional advice. In addition, no part of this site—including articles or product references—constitutes a solicitation, recommendation, endorsement, advertisement, or offer to buy or sell any securities, franchises, or other financial instruments, particularly in jurisdictions where such activity would be unlawful.
All content is of a general nature and may not address the specific circumstances of any individual or entity. It is not a substitute for professional advice or services. Any actions you take based on the information provided here are strictly at your own risk. You accept full responsibility for any decisions or outcomes arising from your use of this website and agree to release us from any liability in connection with your use of, or reliance upon, the content or products found herein.