
|
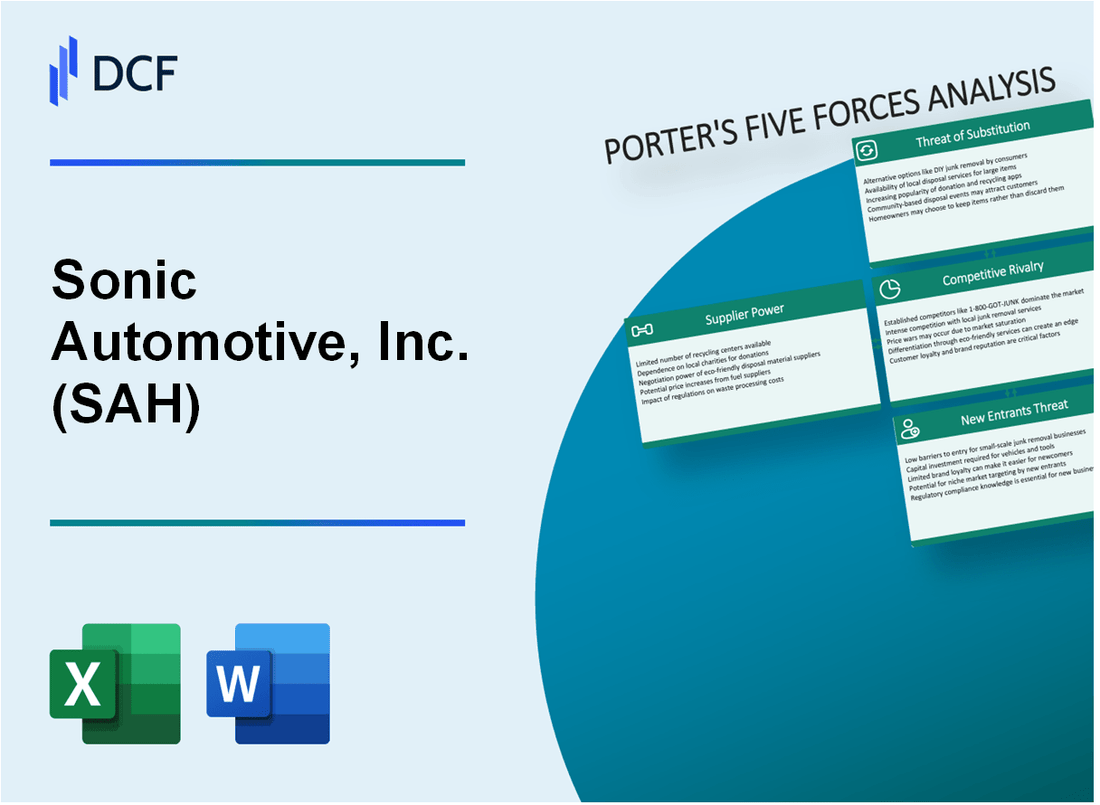
Sonic Automotive, Inc. (SAH): 5 Forces Analysis [Jan-2025 Updated] |
Fully Editable: Tailor To Your Needs In Excel Or Sheets
Professional Design: Trusted, Industry-Standard Templates
Investor-Approved Valuation Models
MAC/PC Compatible, Fully Unlocked
No Expertise Is Needed; Easy To Follow
Sonic Automotive, Inc. (SAH) Bundle
In the high-stakes world of automotive retail, Sonic Automotive, Inc. (SAH) navigates a complex landscape where strategic positioning is everything. By dissecting Michael Porter's Five Forces Framework, we'll unveil the intricate dynamics that shape the company's competitive environment, from the iron grip of manufacturers to the evolving preferences of digital-savvy consumers. Buckle up for an insider's view of how SAH maneuvers through supplier constraints, customer expectations, market rivalries, technological disruptions, and potential new entrants in the cutthroat automotive dealership ecosystem.
Sonic Automotive, Inc. (SAH) - Porter's Five Forces: Bargaining power of suppliers
Limited Number of Major Automobile Manufacturers
Sonic Automotive works with 13 different automotive brands as of 2024. The top manufacturers include:
| Manufacturer | Number of Dealerships | Market Share |
|---|---|---|
| BMW | 37 | 22.5% |
| Mercedes-Benz | 29 | 18.3% |
| Ford | 45 | 27.6% |
Dependency on Specific Auto Brands
Supplier concentration metrics for Sonic Automotive:
- Top 3 suppliers account for 68.4% of total vehicle inventory
- Average supplier contract duration: 3-5 years
- Supplier switching costs: $2.3 million per manufacturer transition
Capital Investments for Dealership Infrastructure
Infrastructure investment requirements:
- Average dealership facility cost: $12.7 million
- Annual maintenance investment: $850,000 per dealership
- Technology infrastructure cost: $1.2 million per location
Supply Chain Manufacturer Relationship Requirements
Manufacturer relationship compliance metrics:
| Compliance Area | Annual Cost | Penalty for Non-Compliance |
|---|---|---|
| Training Programs | $1.6 million | Up to 15% inventory allocation reduction |
| Facility Standards | $2.3 million | Potential brand representation termination |
Sonic Automotive, Inc. (SAH) - Porter's Five Forces: Bargaining power of customers
Extensive Online Pricing Transparency
According to Automotive News, 80% of car buyers research vehicle prices online before purchasing. CarGurus reports that 72% of consumers compare prices across multiple dealerships digitally.
| Digital Price Comparison Metric | Percentage |
|---|---|
| Online Price Research | 80% |
| Multi-Dealership Digital Price Comparison | 72% |
Consumer Price Sensitivity
J.D. Power's 2023 automotive study indicates that 63% of customers prioritize price over brand loyalty. The average price sensitivity in automotive retail market ranges between 5-7% across different vehicle segments.
Dealership Location Negotiation Leverage
Sonic Automotive operates 103 dealership locations across 14 states as of Q4 2023, providing substantial customer negotiation options.
| Dealership Network Metric | Number |
|---|---|
| Total Dealership Locations | 103 |
| States Covered | 14 |
Digital Purchasing Preferences
- 87% of millennials prefer digital car buying experiences
- 65% of consumers want complete online transaction capabilities
- 42% of customers are willing to complete entire vehicle purchase online
McKinsey reports that digital automotive retail channels are projected to reach $76 billion by 2025, highlighting significant consumer shift towards online purchasing.
Sonic Automotive, Inc. (SAH) - Porter's Five Forces: Competitive rivalry
Intense Competition in Automotive Retail
As of 2024, Sonic Automotive operates in a highly competitive automotive retail market with approximately 17,500 franchised dealership groups in the United States. The company faces competition from:
- AutoNation (AN): $26.9 billion revenue in 2022
- Lithia Motors (LAD): $28.7 billion revenue in 2022
- Group 1 Automotive (GPI): $15.8 billion revenue in 2022
| Competitor | Number of Dealerships | Revenue (2022) |
|---|---|---|
| Sonic Automotive | 103 franchised dealerships | $7.8 billion |
| AutoNation | 240 franchised dealerships | $26.9 billion |
| Lithia Motors | 268 franchised dealerships | $28.7 billion |
Competitive Pricing Strategies
The multi-brand dealership market demonstrates aggressive pricing competition, with average gross profit per vehicle at $2,281 in 2022, representing a 5.3% decrease from 2021.
Online Automotive Sales Platforms
Online automotive sales platforms have reached 30.5% of total vehicle sales in 2023, creating significant competitive pressure. Digital retail channels include:
- Carvana: $12.8 billion revenue in 2022
- CarMax: $9.4 billion revenue in 2022
- Vroom: $1.1 billion revenue in 2022
Customer Service Differentiation
Extended warranty offerings represent a $117.5 billion market in 2024, with dealers averaging $1,250 in warranty revenue per vehicle sold.
Sonic Automotive, Inc. (SAH) - Porter's Five Forces: Threat of substitutes
Emerging Car-Sharing and Ride-Sharing Services
As of 2024, the global car-sharing market is valued at $2.7 billion, with a projected CAGR of 24.5% from 2023 to 2030. Uber reported 131 million monthly active platform consumers in Q3 2023, while Lyft recorded 1.4 million active riders in the same period.
| Service | Monthly Active Users | Market Penetration |
|---|---|---|
| Uber | 131 million | 42% |
| Lyft | 1.4 million | 15% |
Growing Electric Vehicle Market
Electric vehicle sales reached 10.5 million units globally in 2022, representing 13% of total vehicle sales. Tesla delivered 1.31 million vehicles in 2022, with a market share of 20% in the EV segment.
- Global EV sales: 10.5 million units
- Tesla market share: 20%
- Projected EV market growth: 18% CAGR through 2030
Leasing Versus Traditional Vehicle Purchasing
In 2023, leasing accounted for 19.7% of new vehicle transactions. Average monthly lease payments were $738, compared to average monthly loan payments of $733 for new vehicles.
| Metric | Leasing | Traditional Purchase |
|---|---|---|
| Market Share | 19.7% | 80.3% |
| Average Monthly Payment | $738 | $733 |
Public Transportation Infrastructure
U.S. public transit ridership in 2022 reached 7.7 billion passenger trips, representing a 54% recovery from pre-pandemic levels. Metropolitan areas like New York City recorded 2.3 billion annual transit trips in 2022.
- Total U.S. public transit trips: 7.7 billion
- New York City transit trips: 2.3 billion
- Transit ridership recovery rate: 54%
Sonic Automotive, Inc. (SAH) - Porter's Five Forces: Threat of new entrants
High Initial Capital Requirements
Sonic Automotive dealership establishment requires approximately $10-15 million in initial capital investment. Typical startup costs include:
| Cost Category | Average Investment |
|---|---|
| Dealership Real Estate | $5-7 million |
| Initial Vehicle Inventory | $3-4 million |
| Facility Infrastructure | $1-2 million |
| Technology Systems | $500,000-$750,000 |
Manufacturer Franchise Agreements
Franchise Entry Barriers:
- Manufacturers require minimum net worth of $1.5-2.5 million
- Dealer performance metrics must meet 95% compliance standards
- Initial franchise fees range from $250,000-$500,000
Regulatory Environment
Automotive retail regulatory compliance involves:
| Regulatory Requirement | Compliance Cost |
|---|---|
| State Dealer Licensing | $10,000-$50,000 annually |
| Federal Trade Commission Regulations | $75,000-$150,000 annually |
| Environmental Compliance | $25,000-$75,000 annually |
Brand Recognition Barriers
Market Entry Challenges:
- Top 10 automotive groups control 23% of total market share
- Sonic Automotive operates 103 dealership locations
- Average customer acquisition cost: $1,200-$1,800 per vehicle
Disclaimer
All information, articles, and product details provided on this website are for general informational and educational purposes only. We do not claim any ownership over, nor do we intend to infringe upon, any trademarks, copyrights, logos, brand names, or other intellectual property mentioned or depicted on this site. Such intellectual property remains the property of its respective owners, and any references here are made solely for identification or informational purposes, without implying any affiliation, endorsement, or partnership.
We make no representations or warranties, express or implied, regarding the accuracy, completeness, or suitability of any content or products presented. Nothing on this website should be construed as legal, tax, investment, financial, medical, or other professional advice. In addition, no part of this site—including articles or product references—constitutes a solicitation, recommendation, endorsement, advertisement, or offer to buy or sell any securities, franchises, or other financial instruments, particularly in jurisdictions where such activity would be unlawful.
All content is of a general nature and may not address the specific circumstances of any individual or entity. It is not a substitute for professional advice or services. Any actions you take based on the information provided here are strictly at your own risk. You accept full responsibility for any decisions or outcomes arising from your use of this website and agree to release us from any liability in connection with your use of, or reliance upon, the content or products found herein.