
|
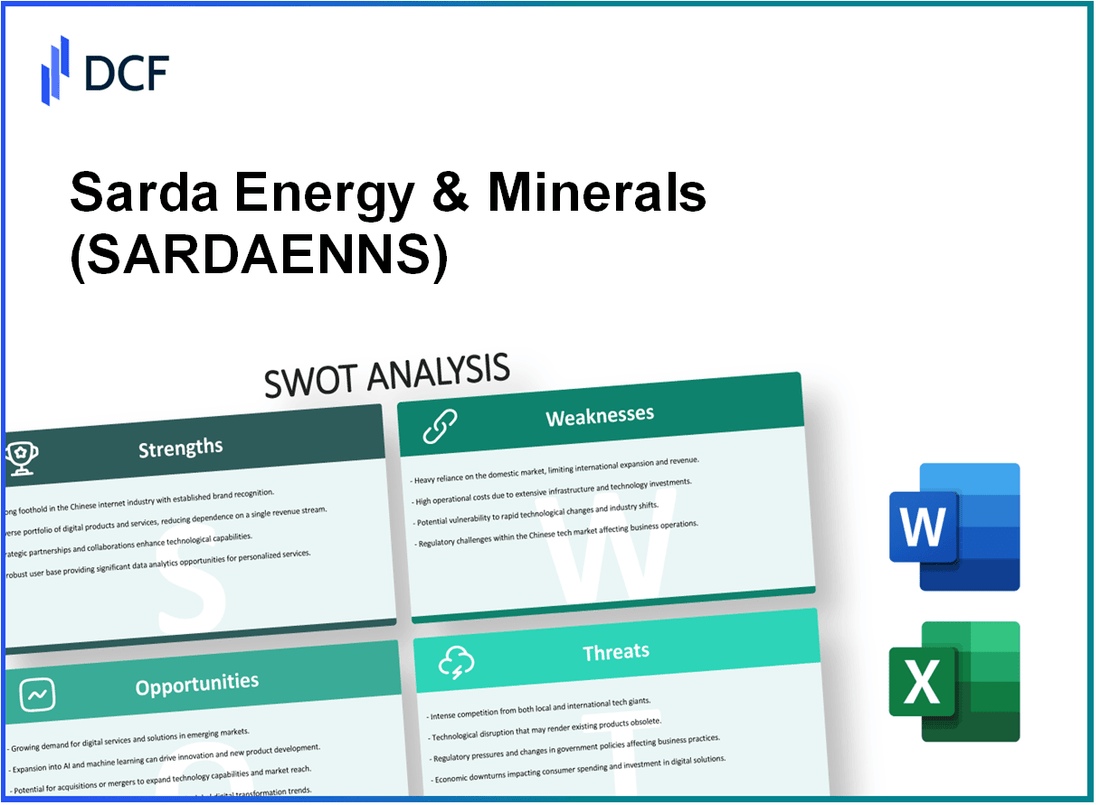
Sarda Energy & Minerals Limited (SARDAEN.NS): SWOT Analysis |
Fully Editable: Tailor To Your Needs In Excel Or Sheets
Professional Design: Trusted, Industry-Standard Templates
Investor-Approved Valuation Models
MAC/PC Compatible, Fully Unlocked
No Expertise Is Needed; Easy To Follow
Sarda Energy & Minerals Limited (SARDAEN.NS) Bundle
In the dynamic landscape of the energy and minerals sector, Sarda Energy & Minerals Limited stands as a formidable player, navigating both opportunities and challenges. This blog post delves into a comprehensive SWOT analysis, revealing the company's strengths that set it apart, the weaknesses it must address, the opportunities ripe for exploration, and the threats lurking in the competitive marketplace. Join us as we unpack these critical elements that shape Sarda's strategic path forward.
Sarda Energy & Minerals Limited - SWOT Analysis: Strengths
Sarda Energy & Minerals Limited (SEML) has a robust standing in both the energy and mineral sectors, with diversified operations across various segments. This diversification empowers the company to mitigate risks associated with market fluctuations. The firm operates in sectors including power generation, iron ore beneficiation, and the production of sponge iron, catering to a comprehensive spectrum of industrial needs.
Financial performance remains a strong point for SEML. For the fiscal year 2023, the company reported a revenue of approximately ₹1,160 crore, showcasing a 15% year-on-year growth from ₹1,008 crore in FY2022. The growth trajectory indicates a solid demand for its products, reinforcing financial stability.
An essential strength of SEML is its access to rich natural resources, including iron ore and coal reserves. The company has significant holdings, which help ensure a sustainable supply chain for its operations. For instance, SEML's iron ore production capacity stands at around 1.2 million tons per annum. Such resource availability positions the company favorably in terms of cost control and operational efficiency.
SEML has built a strong brand reputation and enjoys recognition within the industry. The company has been awarded multiple accolades for its sustainable practices and community contributions. For example, it received the “Best Corporate Social Responsibility Practices” award in 2022, highlighting its commitment to not just operational excellence but also social responsibility.
Technological advancement is another core strength of Sarda Energy. It has invested significantly in modernizing its production processes, utilizing advanced technology to improve efficiency and reduce environmental impact. SEML’s sponge iron production employs state-of-the-art rotary kilns, significantly enhancing production efficiency by approximately 30% compared to traditional methods.
| Strength | Description | Relevant Data |
|---|---|---|
| Diversified Operations | Engaged in power generation and mineral processing. | 1.2 million tons of iron ore capacity |
| Financial Performance | Consistent revenue growth year-over-year. | FY2023 Revenue: ₹1,160 crore |
| Resource Access | Secured supply of raw materials through ownership of reserves. | Significant iron ore and coal holdings |
| Brand Reputation | Recognized for sustainability and community engagement. | Best CSR Practices Award, 2022 |
| Technological Capabilities | Advanced production techniques to enhance efficiency. | 30% efficiency increase with rotary kilns |
Sarda Energy & Minerals Limited - SWOT Analysis: Weaknesses
Sarda Energy & Minerals Limited operates in a highly volatile market characterized by fluctuating global commodity prices. The company’s revenue can be significantly impacted by global market trends, with iron ore prices showing considerable variability. For example, as of September 2023, iron ore prices hovered around $120 per ton, a decrease from the $160 per ton observed in early 2022. This dependency on external market conditions poses a risk to revenue stability.
Moreover, Sarda Energy requires substantial capital investments to maintain and expand its production capabilities. In its latest annual report for FY2022, the company reported capital expenditure of approximately ₹500 crore (approximately $60 million). Such financial obligations could strain its liquidity, especially in light of unexpected expenses or market downturns.
In terms of market presence, Sarda Energy's global market penetration is limited when compared to larger competitors, such as Tata Steel and JSW Steel. As of 2023, Sarda held a market share of around 2% in the Indian steel industry, while Tata Steel and JSW Steel controlled approximately 19% and 14%, respectively. This disparity in market reach and brand recognition restricts growth opportunities and competitive positioning.
The company also faces operational inefficiencies due to its diverse array of production facilities. With multiple plants spread across different regions, Sarda Energy may encounter logistical challenges and higher overhead costs. In the most recent fiscal year, the operating margin was reported at 12%, which is lower than the industry average of 15%, indicating potential inefficiencies in resource allocation and production processes.
Lastly, Sarda Energy is vulnerable to regulatory and environmental compliance issues. The mining and minerals sector is heavily regulated, and any non-compliance can result in significant penalties and operational delays. As of 2023, the company reported spending over ₹100 crore (approximately $12 million) on compliance-related costs, which could escalate further with stricter regulations.
| Weakness | Details | Financial Impact |
|---|---|---|
| High Dependency on Commodity Prices | Fluctuating iron ore prices | Impact on revenue stability |
| Capital Investment Requirements | Annual capital expenditure | ₹500 crore (~$60 million) |
| Limited Global Market Penetration | Market share compared to competitors | 2% (vs. Tata Steel's 19%) |
| Operational Inefficiencies | Multiple production facilities | Operating margin at 12% (industry average: 15%) |
| Regulatory Compliance Vulnerability | Cost of compliance | ₹100 crore (~$12 million) |
Sarda Energy & Minerals Limited - SWOT Analysis: Opportunities
Sarda Energy & Minerals Limited stands at a pivotal juncture to capitalize on various opportunities within the energy and minerals sectors. The company can leverage these prospects to enhance its market position and achieve sustained growth.
Expansion into Renewable Energy Sources Aligning with Global Sustainability Trends
The global renewable energy market is projected to grow from $1.52 trillion in 2021 to $2.15 trillion by 2025, at a CAGR of 10.5%. By investing in renewable energy projects, Sarda can align its operations with these trends, meeting increasing regulatory pressures and consumer demand for sustainable energy.
Increasing Demand for Steel and Minerals in Developing Regions
The World Steel Association anticipates that global steel demand will reach 1.95 billion tonnes by 2025, especially driven by countries such as India and ASEAN nations. These regions have seen a surge in construction and infrastructure projects, further bolstering the demand for minerals and related products.
Strategic Partnerships and Joint Ventures to Enhance Market Presence
Sarda Energy has the opportunity to forge strategic alliances in the mineral sector. For example, in 2022, the total value of mergers and acquisitions in the mining sector was approximately $37 billion, indicating a growing trend towards consolidation, which Sarda could leverage to enhance its market share.
Technological Advancements for Improving Production Efficiency and Reducing Costs
Industry analysts report that technological innovations can reduce operational costs by up to 20%. Sarda can invest in automation and advanced analytics, potentially improving its production efficiency and profit margins in an increasingly competitive landscape.
Exploration of Untapped International Markets to Broaden Customer Base
According to the International Trade Centre, mineral exports from India have seen a growth rate of approximately 12% from 2020 to 2023. By expanding into new international markets, particularly in Africa and Latin America, Sarda can diversify its revenue streams and mitigate risks associated with domestic market fluctuations.
| Opportunity | Market Value or Growth Rate | Additional Insights |
|---|---|---|
| Renewable Energy Market Growth | $1.52 trillion (2021) to $2.15 trillion (2025) | CAGR of 10.5% |
| Global Steel Demand | 1.95 billion tonnes by 2025 | Driven by developing regions, especially India |
| Mergers and Acquisitions in Mining | $37 billion in 2022 | Indicates market consolidation trends |
| Operational Cost Reduction from Technology | 20% reduction | Through automation and advanced analytics |
| Mineral Export Growth Rate | 12% growth from 2020 to 2023 | Significant in Africa and Latin America |
Sarda Energy & Minerals Limited - SWOT Analysis: Threats
The energy sector is highly susceptible to fluctuations, with recent trends showing significant volatility in energy prices. For instance, the price of coal, a primary energy source for Sarda Energy & Minerals Limited, has experienced changes from approximately USD 50 per tonne in early 2021 to over USD 250 per tonne in late 2022. This volatility impacts cost structures and profitability margins, making it a formidable threat to the company's financial stability.
Moreover, Sarda Energy faces intense competition from both domestic companies and international players. In India, companies like Tata Power and Adani Green Energy have escalated their market presence. As per the latest data, the renewable energy capacity in India reached approximately 107 GW in 2023, intensifying the competition in the energy sector. The competition has caused pressure on pricing and market share, potentially impacting Sarda Energy's revenue growth.
Changes in regulations and environmental policies present another threat. The Indian government has implemented various initiatives aimed at reducing carbon emissions, including stricter norms for thermal power generation. For example, the Ministry of Environment and Forests introduced a guideline to reduce emissions from thermal power plants by 30% by 2030. These regulations may restrict operational flexibility and increase compliance costs for Sarda Energy.
Economic downturns can lead to reduced demand for core products. The International Monetary Fund (IMF) projected a global growth rate decline to 2.7% for 2023, impacting industrial output and therefore, the demand for energy products that Sarda Energy supplies. In 2022, the company reported a year-on-year decline in revenue of approximately 15% attributed to decreased demand in core sectors during economic slowdowns.
Geopolitical tensions also threaten supply chain stability. Recent events, such as the Russia-Ukraine conflict, have disrupted energy supply chains and resulted in spikes in energy prices. The World Bank noted that global commodity prices rose by approximately 30% in 2022 due to such geopolitical tensions. As Sarda Energy sources materials from various global suppliers, inconsistent availability and pricing could significantly affect operations and profitability.
| Threat Type | Description | Impact on Sarda Energy |
|---|---|---|
| Volatility in Energy Prices | Coal prices fluctuated from USD 50 to USD 250 per tonne. | Increased cost structures, reduced profitability. |
| Intense Competition | Domestic competitors like Tata Power and Adani Green Energy with a total capacity of 107 GW. | Pressure on pricing, loss of market share. |
| Regulatory Changes | Emission reduction guideline targeting 30% reductions by 2030. | Increased compliance costs, operational restrictions. |
| Economic Downturns | Global growth rate projected at 2.7% for 2023. | Decreased demand resulted in a 15% revenue decline in 2022. |
| Geopolitical Tensions | Commodity prices rose by 30% in 2022 due to conflicts. | Supply chain disruptions, increased operational costs. |
The SWOT analysis of Sarda Energy & Minerals Limited highlights its stronghold in the energy and minerals sectors while also exposing vulnerabilities and opportunities for growth. By leveraging its strengths, such as robust financial performance and technological capabilities, the company can strategically navigate weaknesses and external threats, positioning itself for advancement in a competitive landscape.
Disclaimer
All information, articles, and product details provided on this website are for general informational and educational purposes only. We do not claim any ownership over, nor do we intend to infringe upon, any trademarks, copyrights, logos, brand names, or other intellectual property mentioned or depicted on this site. Such intellectual property remains the property of its respective owners, and any references here are made solely for identification or informational purposes, without implying any affiliation, endorsement, or partnership.
We make no representations or warranties, express or implied, regarding the accuracy, completeness, or suitability of any content or products presented. Nothing on this website should be construed as legal, tax, investment, financial, medical, or other professional advice. In addition, no part of this site—including articles or product references—constitutes a solicitation, recommendation, endorsement, advertisement, or offer to buy or sell any securities, franchises, or other financial instruments, particularly in jurisdictions where such activity would be unlawful.
All content is of a general nature and may not address the specific circumstances of any individual or entity. It is not a substitute for professional advice or services. Any actions you take based on the information provided here are strictly at your own risk. You accept full responsibility for any decisions or outcomes arising from your use of this website and agree to release us from any liability in connection with your use of, or reliance upon, the content or products found herein.