
|
Saregama India Limited (SAREGAMA.NS) DCF Valuation |
Fully Editable: Tailor To Your Needs In Excel Or Sheets
Professional Design: Trusted, Industry-Standard Templates
Investor-Approved Valuation Models
MAC/PC Compatible, Fully Unlocked
No Expertise Is Needed; Easy To Follow
Saregama India Limited (SAREGAMA.NS) Bundle
Whether you’re an investor or analyst, this (SAREGAMANS) DCF Calculator is your go-to resource for accurate valuation. Featuring real data from Saregama India Limited, you can easily adjust forecasts and observe the effects immediately.
What You Will Gain
- Editable Forecast Inputs: Seamlessly adjust key assumptions (growth %, margins, WACC) to develop various scenarios.
- Real-World Data: Saregama India's financial data pre-loaded to kickstart your analysis.
- Automatic DCF Outputs: The template computes Net Present Value (NPV) and intrinsic value automatically.
- Customizable and Professional: A refined Excel model designed to meet your valuation requirements.
- Designed for Analysts and Investors: Perfect for evaluating projections, confirming strategies, and enhancing efficiency.
Key Features
- Accurate Financial Data: Gain access to meticulously compiled historical records and future forecasts for Saregama India Limited (SAREGAMANS).
- Adjustable Forecast Parameters: Modify highlighted cells such as WACC, growth rates, and profit margins to suit your analysis.
- Real-Time Calculations: Enjoy automatic updates to DCF, Net Present Value (NPV), and cash flow evaluations.
- User-Friendly Dashboard: Utilize intuitive charts and summaries for an at-a-glance view of your valuation outcomes.
- Designed for All Experience Levels: An accessible and straightforward framework tailored for investors, CFOs, and consultants alike.
How It Works
- Step 1: Download the Excel file.
- Step 2: Review the pre-filled data for Saregama India Limited (SAREGAMANS), including historical and projected figures.
- Step 3: Modify key assumptions (highlighted in yellow) according to your analysis.
- Step 4: Observe the automatic recalculations of Saregama's intrinsic value.
- Step 5: Utilize the results for your investment strategies or reporting needs.
Why Opt for This Calculator?
- User-Friendly Interface: Perfect for both novices and seasoned professionals.
- Customizable Inputs: Adjust parameters to tailor your financial analysis.
- Real-Time Valuation: Observe immediate updates to Saregama India Limited's valuation as you alter inputs.
- Preloaded Data: Comes with Saregama's actual financial metrics for efficient analysis.
- Endorsed by Experts: Trusted by investors and analysts for making well-informed choices.
Who Should Utilize Saregama India Limited (SAREGAMANS)?
- Investors: Make informed investment choices with a leading valuation tool tailored for Saregama India Limited (SAREGAMANS).
- Financial Analysts: Streamline your analysis with a customizable DCF model specifically designed for Saregama India Limited (SAREGAMANS).
- Consultants: Easily modify the template for presentations or reports focused on Saregama India Limited (SAREGAMANS).
- Finance Enthusiasts: Enhance your grasp of valuation methodologies through real-world insights into Saregama India Limited (SAREGAMANS).
- Educators and Students: Incorporate it as a hands-on resource in finance-related academic programs, centered on Saregama India Limited (SAREGAMANS).
Contents of the Template
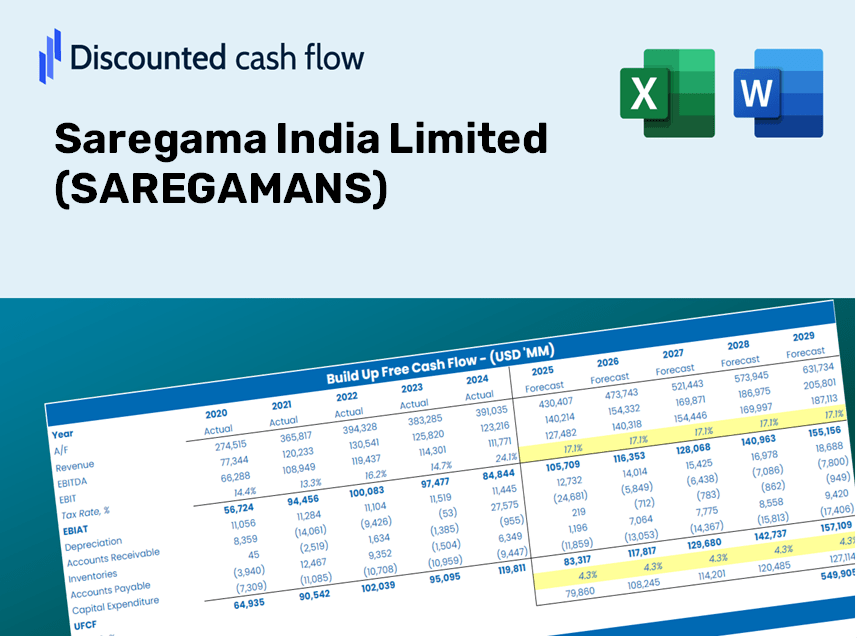
- Operating and Balance Sheet Data: Pre-filled historical data and forecasts for Saregama India Limited (SAREGAMANS), including revenue, EBITDA, EBIT, and capital expenditures.
- WACC Calculation: A dedicated sheet for calculating the Weighted Average Cost of Capital (WACC), featuring parameters such as Beta, risk-free rate, and share price.
- DCF Valuation (Unlevered and Levered): Customizable Discounted Cash Flow models that detail the intrinsic value with comprehensive calculations.
- Financial Statements: Pre-loaded annual and quarterly financial statements for Saregama India Limited (SAREGAMANS) to aid in analysis.
- Key Ratios: Includes critical profitability, leverage, and efficiency ratios specific to Saregama India Limited (SAREGAMANS).
- Dashboard and Charts: A visual overview of the valuation outputs and assumptions to facilitate easy result analysis.
Disclaimer
All information, articles, and product details provided on this website are for general informational and educational purposes only. We do not claim any ownership over, nor do we intend to infringe upon, any trademarks, copyrights, logos, brand names, or other intellectual property mentioned or depicted on this site. Such intellectual property remains the property of its respective owners, and any references here are made solely for identification or informational purposes, without implying any affiliation, endorsement, or partnership.
We make no representations or warranties, express or implied, regarding the accuracy, completeness, or suitability of any content or products presented. Nothing on this website should be construed as legal, tax, investment, financial, medical, or other professional advice. In addition, no part of this site—including articles or product references—constitutes a solicitation, recommendation, endorsement, advertisement, or offer to buy or sell any securities, franchises, or other financial instruments, particularly in jurisdictions where such activity would be unlawful.
All content is of a general nature and may not address the specific circumstances of any individual or entity. It is not a substitute for professional advice or services. Any actions you take based on the information provided here are strictly at your own risk. You accept full responsibility for any decisions or outcomes arising from your use of this website and agree to release us from any liability in connection with your use of, or reliance upon, the content or products found herein.