
|
State Bank of India (SBIN.NS): BCG Matrix |
Fully Editable: Tailor To Your Needs In Excel Or Sheets
Professional Design: Trusted, Industry-Standard Templates
Investor-Approved Valuation Models
MAC/PC Compatible, Fully Unlocked
No Expertise Is Needed; Easy To Follow
State Bank of India (SBIN.NS) Bundle
The Boston Consulting Group (BCG) Matrix offers a compelling framework to analyze the diverse portfolio of the State Bank of India (SBI). In this dynamic landscape, SBI's offerings range from high-growth stars in digital banking to cash cows like corporate banking services, each presenting unique opportunities and challenges. Curious about how these segments perform and their implications for investment strategies? Dive into the detailed exploration below!
Background of State Bank of India
State Bank of India (SBI) is India's largest public sector bank, with a rich history that dates back to 1806 when it was established as the Bank of Calcutta. The bank was later renamed the Bank of Bengal, and it underwent several transformations before becoming the Imperial Bank of India in 1921. In 1955, the Government of India nationalized the Imperial Bank, and it was rebranded as the State Bank of India, solidifying its position as a leading financial institution in the nation.
SBI operates more than 22,000 branches across India and has a significant presence in international markets with branches in 30 countries. It serves over 460 million customers and offers a wide range of financial services, including personal banking, corporate banking, investment banking, and insurance.
As of March 2023, SBI reported a total asset base of approximately INR 51 trillion, making it a key player in India's banking sector. The bank has consistently ranked among the top banks globally in terms of total assets and market capitalization. In the Financial Year 2022-2023, SBI posted a net profit of around INR 40,000 crore, showcasing a robust return on equity (ROE) of 14%.
SBI is also known for its strong focus on digital banking and innovation. The bank has invested heavily in technology, launching various digital initiatives to enhance customer experience and streamline operations. As of 2023, SBI has over 90 million active users on its mobile banking platform, reflecting its commitment to adapting to the evolving financial landscape.
With a diverse portfolio and a significant market share in retail loans, corporate loans, and deposits, SBI remains a critical player in the Indian economy. The bank's strategic initiatives, such as expanding its reach in rural areas and enhancing customer service, have further solidified its reputation as a trusted financial institution.
State Bank of India - BCG Matrix: Stars
Retail Banking Services
State Bank of India (SBI) holds a commanding position in retail banking in India, with a market share of approximately 23%. As of March 2023, SBI's retail banking segment contributed around 53% to its total net interest income (NII), translating to about ₹89,300 crore in the financial year 2022-2023. In 2023, SBI reported over 45 million retail customers, showcasing its dominant growth and extensive reach in a growing market.
Digital Banking Platforms
SBI's digital banking initiatives have surged, driven by increased internet penetration and customer preferences for digital transactions. The bank reported over 100 million registered users on its YONO app, having processed transactions worth about ₹4.5 lakh crore in FY 2022-2023. This digital transformation has not only enhanced customer experience but also reduced operational costs by approximately 30%.
Home Loan Products
SBI is a leading player in the home loan segment, ranking first in the country. As of June 2023, the bank's home loan portfolio stood at ₹6.3 lakh crore with a market share of around 34%. SBI has also reported a year-on-year growth of 15% in home loans, which reflects its ability to leverage the growing demand for housing loans, backed by favorable interest rates and government incentives.
Payment Solutions and Wallets
In the realm of payment solutions, SBI's digital wallet, YONO, has gained traction with over 30 million downloads. The payment gateway solutions provided by SBI are witnessing increased usage, processing over 1 billion transactions in FY 2022-2023, representing a growth rate of 40% compared to the previous fiscal year. SBI's focus on enhancing payment infrastructure and security is crucial for maintaining its competitive edge in a rapidly growing digital payments market.
| Segment | Market Share | Contribution to NII (FY 2023) | User Base / Transactions | Year-on-Year Growth |
|---|---|---|---|---|
| Retail Banking Services | 23% | ₹89,300 crore | 45 million customers | 15% |
| Digital Banking Platforms | N/A | N/A | 100 million YONO users | 30% cost reduction |
| Home Loan Products | 34% | N/A | ₹6.3 lakh crore | 15% |
| Payment Solutions and Wallets | N/A | N/A | 30 million YONO downloads | 40% |
State Bank of India - BCG Matrix: Cash Cows
The Cash Cow segment of the State Bank of India (SBI) showcases strong business units with high market share in a mature market. These units contribute significantly to the bank's overall cash flow, maintaining profitability and supporting other growth initiatives.
Corporate Banking Services
SBI's corporate banking services stand out as a significant Cash Cow. For the fiscal year 2022-2023, SBI reported a robust ₹3.75 trillion in corporate loan book, with a market share of approximately 18% in the corporate lending space. The profitability margin of corporate banking ranges around 3.5%, driven by the extensive service portfolio ranging from term loans to treasury management.
Fixed Deposit Schemes
Fixed deposit schemes are a crucial revenue stream for SBI. As of October 2023, the bank holds over ₹6 trillion in fixed deposits, making SBI one of the leaders in this category. The average interest rate offered on these deposits hovers around 6.50%, providing a stable income with minimal marketing costs. This segment is pivotal, with a contribution of approximately 40% to SBI's net interest income.
Savings Accounts
SBI's savings accounts are another essential Cash Cow for the bank. The bank has over 500 million savings account holders, securing a market share of about 23%. The savings account deposits amount to approximately ₹5 trillion. With a competitive interest rate of 3.00%, this service ensures a steady inflow of funds, enabling the bank to capitalize on its significant customer base.
ATM Networks
SBI operates the largest ATM network in India, with over 70,000 ATMs as of the end of 2023. This extensive network facilitates cost-effective transactions, curbing operational costs by 25%. The ATM transactions contribute significantly to the bank’s fee-based income, generating approximately ₹18 billion annually. With a transaction volume that continues to grow by about 12% year-over-year, the ATM network remains a stable revenue-generating asset.
| Cash Cow Segment | Financial Metrics | Market Share | Annual Revenue Contribution |
|---|---|---|---|
| Corporate Banking Services | ₹3.75 trillion (loan book) | 18% | Approximately ₹130 billion (profit) |
| Fixed Deposit Schemes | ₹6 trillion (deposits) | Market leader | 40% of net interest income |
| Savings Accounts | ₹5 trillion (deposits) | 23% | Steady inflow of funds |
| ATM Networks | 70,000 ATMs | Largest in India | ₹18 billion (annual income) |
State Bank of India - BCG Matrix: Dogs
Within the State Bank of India (SBI), certain segments can be classified as 'Dogs,' characterized by low market share in low growth markets. This section explores these underperforming units.
International Branches with Low Profitability
SBI has expanded its international presence, operating in over 30 countries. However, certain branches are struggling to achieve profitability. For example, SBI's international operations reported a net loss of approximately INR 1,000 crore in the fiscal year 2022. Particularly, branches in regions such as the Middle East and Europe have shown stagnant growth rates with a market share of less than 1%.
Obsolete Technology Platforms
SBI has invested significantly in digital banking, yet some legacy systems pose challenges. The maintenance costs of these outdated platforms exceed INR 500 crore annually, while the revenue generated from transactions using these platforms has decreased by 15% over the past three years. The inability to upgrade these systems contributes to the low growth outlook, as they capture a diminishing share of customer interactions.
Traditional Brick-and-Mortar Branches in Low Traffic Areas
The bank operates approximately 22,000 branches across India. However, many are situated in low traffic areas with diminishing customer footfall. For instance, SBI reported that around 20% of its branches experience less than 50 transactions per day. These branches incur operational costs exceeding INR 350 crore annually without generating significant revenues, leading to assessments of divestiture.
| Area | Details | Financial Impact (INR crore) | Market Share (%) | Growth Rate (%) |
|---|---|---|---|---|
| International Branches | Operating in over 30 countries | -1,000 | 0.5 | -2 |
| Obsolete Technology | Legacy systems maintenance cost | 500 | N/A | -15 |
| Brick-and-Mortar Branches | Branches in low traffic areas | 350 | 20 | -3 |
These 'Dogs' represent a significant concern for SBI, as they absorb resources without returning adequate value. Identifying and addressing these units is critical for optimizing the bank's overall performance and financial health.
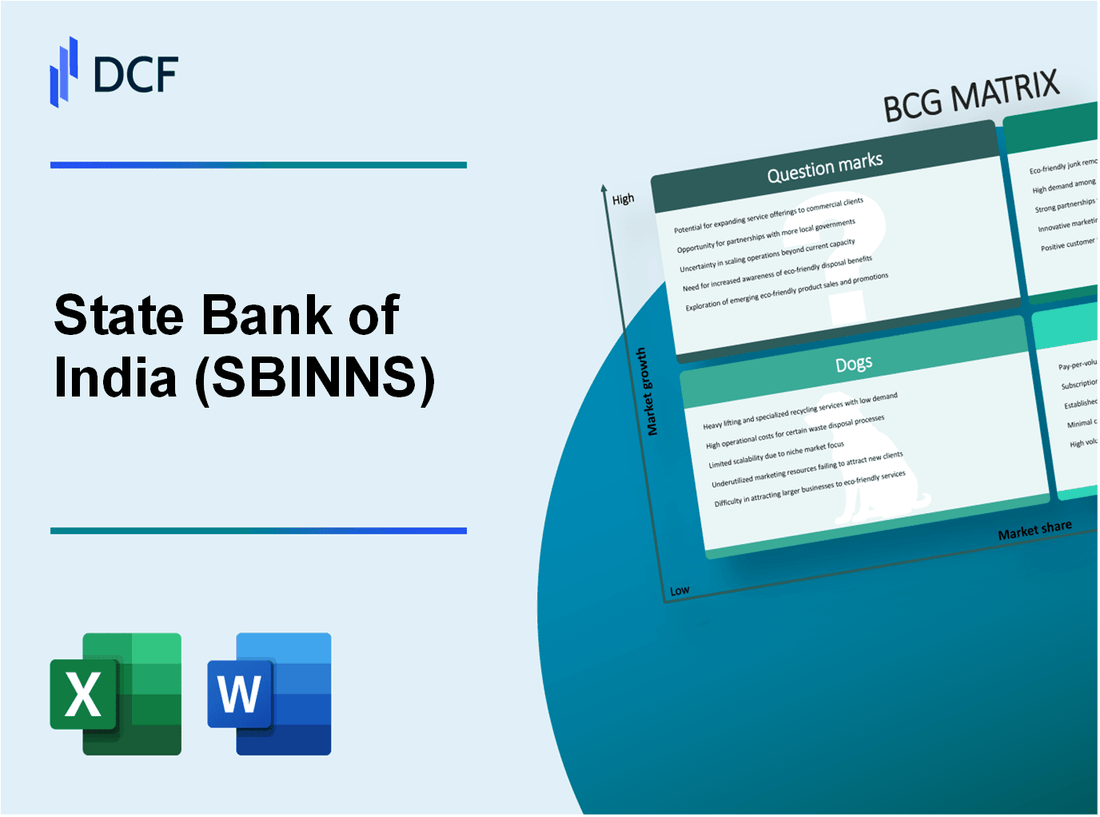
State Bank of India - BCG Matrix: Question Marks
In the context of the Boston Consulting Group (BCG) Matrix, State Bank of India (SBI) possesses several business units categorized as Question Marks. These units show high growth potential yet currently maintain low market shares, reflecting significant investment opportunities as well as risks. Below are key areas identified as Question Marks.
Wealth Management Services
SBI’s wealth management services have been expanding following the growth of the Indian affluent class. According to the 2023 Economic Times Wealth Management Report, the wealth management industry in India is expected to grow from ₹27 trillion in 2023 to approximately ₹64 trillion by 2027, indicating a robust CAGR of about 24%.
However, SBI’s wealth management unit holds only a 5% market share against competitors like HDFC and ICICI, which dominate the sector. To capitalize on this growth, SBI will need to enhance marketing efforts and customer engagement strategies.
Microfinance Initiatives
Microfinance operations have gained traction in India, particularly in rural and semi-urban areas. SBI has recently reported a 20% increase in microfinance loan disbursements, reaching approximately ₹15,000 crore in FY2023. However, the bank's microfinance division still commands a mere 3% market share in the industry.
SBI's microfinance initiatives are essential for financial inclusion, yet currently, they are seen as Question Marks due to high operational costs and a low return on investment. Strategic investments in technology and partnerships with FinTech firms could enhance scalability and operational efficiencies.
Insurance Products
SBI Life Insurance, a subsidiary of SBI, achieved a premium income of around ₹22,000 crore in FY2023. Despite this, SBI Life’s market share is just 8% in the Indian life insurance market, which is projected to grow at a CAGR of 12% through 2027 according to the IRDAI annual report.
The insurance sector presents an opportunity for SBI; however, the low market share indicates a need for enhanced product offerings and aggressive marketing strategies to capture a larger consumer base and convert these offerings into Stars.
Sustainable and Green Banking Products
SBI has recently ventured into sustainable and green banking initiatives aimed at funding eco-friendly projects. The Indian green finance market is on track to reach ₹10 trillion by 2025. SBI’s market share in this niche is currently estimated at only 2%.
As part of its sustainable banking strategy, SBI plans to allocate ₹1,000 crore specifically to green initiatives, yet returns are currently low due to minimal adoption. Investment in marketing and collaboration with environmental organizations could help elevate these products to a stronger position in the market.
| Product Category | 2023 Market Size (₹ Trillion) | Current Market Share (%) | Projected Market Growth (%) | Investment Required (₹ Crore) |
|---|---|---|---|---|
| Wealth Management Services | 27 | 5 | 24 | 500 |
| Microfinance Initiatives | 50 | 3 | 20 | 300 |
| Insurance Products | 275 | 8 | 12 | 400 |
| Sustainable & Green Banking Products | 10 | 2 | 30 | 1000 |
These statistics underscore the need for SBI to strategically invest in these Question Mark categories to either enhance their market share or reassess their viability moving forward. The dynamic financial landscape necessitates agility and adaptability, particularly in sectors that exhibit rapid growth potential.
In conclusion, the Boston Consulting Group Matrix offers a compelling lens through which to analyze the State Bank of India's diverse portfolio, highlighting its strengths in retail and corporate banking while pinpointing potential growth areas and challenges. Understanding where each segment stands—as Stars, Cash Cows, Dogs, or Question Marks—can help investors and analysts make informed decisions about the bank's future trajectory and strategic focus.
[right_small]Disclaimer
All information, articles, and product details provided on this website are for general informational and educational purposes only. We do not claim any ownership over, nor do we intend to infringe upon, any trademarks, copyrights, logos, brand names, or other intellectual property mentioned or depicted on this site. Such intellectual property remains the property of its respective owners, and any references here are made solely for identification or informational purposes, without implying any affiliation, endorsement, or partnership.
We make no representations or warranties, express or implied, regarding the accuracy, completeness, or suitability of any content or products presented. Nothing on this website should be construed as legal, tax, investment, financial, medical, or other professional advice. In addition, no part of this site—including articles or product references—constitutes a solicitation, recommendation, endorsement, advertisement, or offer to buy or sell any securities, franchises, or other financial instruments, particularly in jurisdictions where such activity would be unlawful.
All content is of a general nature and may not address the specific circumstances of any individual or entity. It is not a substitute for professional advice or services. Any actions you take based on the information provided here are strictly at your own risk. You accept full responsibility for any decisions or outcomes arising from your use of this website and agree to release us from any liability in connection with your use of, or reliance upon, the content or products found herein.