
|
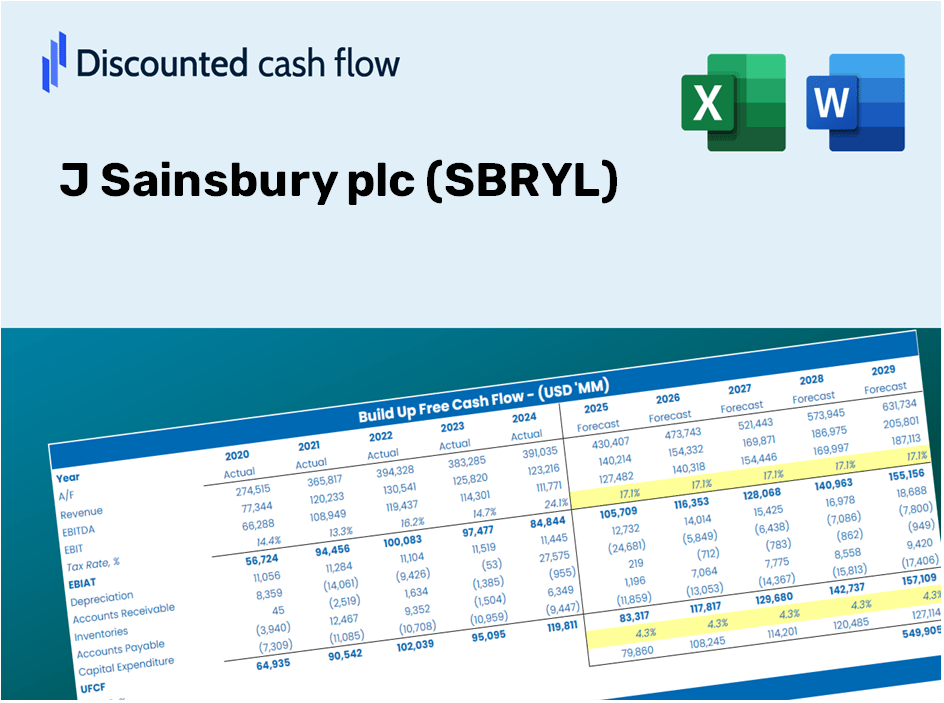
J Sainsbury plc (SBRY.L) DCF Valuation |
Fully Editable: Tailor To Your Needs In Excel Or Sheets
Professional Design: Trusted, Industry-Standard Templates
Investor-Approved Valuation Models
MAC/PC Compatible, Fully Unlocked
No Expertise Is Needed; Easy To Follow
J Sainsbury plc (SBRY.L) Bundle
Looking to assess the intrinsic value of J Sainsbury plc? Our (SBRYL) DCF Calculator integrates real-world data with extensive customization features, enabling you to refine projections and enhance your investment choices.
Discounted Cash Flow (DCF) - (USD MM)
| Year | AY1 2021 |
AY2 2022 |
AY3 2023 |
AY4 2024 |
AY5 2025 |
FY1 2026 |
FY2 2027 |
FY3 2028 |
FY4 2029 |
FY5 2030 |
|---|---|---|---|---|---|---|---|---|---|---|
| Revenue | 29,048.0 | 29,895.0 | 31,491.0 | 32,700.0 | 32,812.0 | 33,832.1 | 34,884.0 | 35,968.6 | 37,086.9 | 38,239.9 |
| Revenue Growth, % | 0 | 2.92 | 5.34 | 3.84 | 0.34251 | 3.11 | 3.11 | 3.11 | 3.11 | 3.11 |
| EBITDA | 1,436.0 | 2,395.0 | 1,844.0 | 1,791.0 | 1,573.0 | 1,967.8 | 2,029.0 | 2,092.0 | 2,157.1 | 2,224.2 |
| EBITDA, % | 4.94 | 8.01 | 5.86 | 5.48 | 4.79 | 5.82 | 5.82 | 5.82 | 5.82 | 5.82 |
| Depreciation | 1,249.0 | 1,220.0 | 1,208.0 | 1,178.0 | 508.0 | 1,175.2 | 1,211.7 | 1,249.4 | 1,288.2 | 1,328.3 |
| Depreciation, % | 4.3 | 4.08 | 3.84 | 3.6 | 1.55 | 3.47 | 3.47 | 3.47 | 3.47 | 3.47 |
| EBIT | 187.0 | 1,175.0 | 636.0 | 613.0 | 1,065.0 | 792.6 | 817.3 | 842.7 | 868.9 | 895.9 |
| EBIT, % | 0.64376 | 3.93 | 2.02 | 1.87 | 3.25 | 2.34 | 2.34 | 2.34 | 2.34 | 2.34 |
| Total Cash | 1,665.0 | 1,021.0 | 1,813.0 | 2,004.0 | 727.0 | 1,573.1 | 1,622.0 | 1,672.4 | 1,724.4 | 1,778.0 |
| Total Cash, percent | .0 | .0 | .0 | .0 | .0 | .0 | .0 | .0 | .0 | .0 |
| Account Receivables | 3,697.0 | 3,674.0 | 3,937.0 | 3,442.0 | 572.0 | 3,368.9 | 3,473.6 | 3,581.6 | 3,693.0 | 3,807.8 |
| Account Receivables, % | 12.73 | 12.29 | 12.5 | 10.53 | 1.74 | 9.96 | 9.96 | 9.96 | 9.96 | 9.96 |
| Inventories | 1,625.0 | 1,797.0 | 1,899.0 | 1,927.0 | 1,946.0 | 1,993.3 | 2,055.3 | 2,119.2 | 2,185.1 | 2,253.0 |
| Inventories, % | 5.59 | 6.01 | 6.03 | 5.89 | 5.93 | 5.89 | 5.89 | 5.89 | 5.89 | 5.89 |
| Accounts Payable | 2,873.0 | 2,965.0 | 3,361.0 | 3,764.0 | 5,278.0 | 3,929.8 | 4,052.0 | 4,177.9 | 4,307.8 | 4,441.8 |
| Accounts Payable, % | 9.89 | 9.92 | 10.67 | 11.51 | 16.09 | 11.62 | 11.62 | 11.62 | 11.62 | 11.62 |
| Capital Expenditure | -595.0 | -694.0 | -738.0 | -1,565.0 | -617.0 | -905.3 | -933.5 | -962.5 | -992.4 | -1,023.3 |
| Capital Expenditure, % | -2.05 | -2.32 | -2.34 | -4.79 | -1.88 | -2.68 | -2.68 | -2.68 | -2.68 | -2.68 |
| Tax Rate, % | 61.03 | 61.03 | 61.03 | 61.03 | 61.03 | 61.03 | 61.03 | 61.03 | 61.03 | 61.03 |
| EBITAT | 237.2 | 931.5 | 402.6 | 303.2 | 415.0 | 524.7 | 541.0 | 557.9 | 575.2 | 593.1 |
| Depreciation | ||||||||||
| Changes in Account Receivables | ||||||||||
| Changes in Inventories | ||||||||||
| Changes in Accounts Payable | ||||||||||
| Capital Expenditure | ||||||||||
| UFCF | -1,557.8 | 1,400.5 | 903.6 | 786.2 | 4,671.0 | -3,397.9 | 774.7 | 798.8 | 823.6 | 849.3 |
| WACC, % | 6.28 | 5.93 | 5.67 | 5.44 | 5.26 | 5.71 | 5.71 | 5.71 | 5.71 | 5.71 |
| PV UFCF | ||||||||||
| SUM PV UFCF | -542.1 | |||||||||
| Long Term Growth Rate, % | 2.00 | |||||||||
| Free cash flow (T + 1) | 866 | |||||||||
| Terminal Value | 23,323 | |||||||||
| Present Terminal Value | 17,666 | |||||||||
| Enterprise Value | 17,124 | |||||||||
| Net Debt | 5,881 | |||||||||
| Equity Value | 11,243 | |||||||||
| Diluted Shares Outstanding, MM | 2,374 | |||||||||
| Equity Value Per Share | 473.55 |
What You Will Receive
- Real SBRYL Financials: Access to historical and projected data for precise valuation.
- Customizable Inputs: Adjust parameters such as WACC, tax rates, revenue growth, and capital expenditures.
- Automated Calculations: Dynamic calculations for intrinsic value and NPV.
- Scenario Analysis: Evaluate various scenarios to assess the future performance of J Sainsbury plc.
- User-Friendly Design: Crafted for professionals while remaining approachable for novices.
Key Features
- Customizable Forecast Inputs: Adjust essential factors such as sales growth, operating margin, and capital expenditures.
- Instant DCF Valuation: Quickly computes intrinsic value, NPV, and additional financial metrics.
- High-Quality Accuracy: Leverages J Sainsbury plc's (SBRYL) actual financial data for precise valuation results.
- Effortless Scenario Analysis: Easily evaluate varying assumptions and analyze different outcomes.
- Efficiency Booster: Removes the necessity for constructing intricate valuation models from the ground up.
How It Works
- Step 1: Download the prebuilt Excel template featuring J Sainsbury plc's (SBRYL) data.
- Step 2: Review the pre-filled sheets to familiarize yourself with the essential metrics.
- Step 3: Modify forecasts and assumptions in the editable yellow cells (WACC, growth, margins).
- Step 4: Instantly view the updated results, including J Sainsbury plc's (SBRYL) intrinsic value.
- Step 5: Utilize the outputs to make informed investment decisions or create detailed reports.
Why Choose This Calculator for J Sainsbury plc (SBRYL)?
- Accurate Data: Utilize real financial data from J Sainsbury plc for dependable valuation outcomes.
- Customizable: Fine-tune essential parameters such as growth rates, WACC, and tax rates to align with your forecasts.
- Time-Saving: Preconfigured calculations save you the effort of building models from the ground up.
- Professional-Grade Tool: Tailored for investors, analysts, and financial consultants.
- User-Friendly: Designed with an intuitive interface and clear step-by-step guidance for all users.
Who Can Benefit from J Sainsbury plc (SBRYL)?
- Investors: Make informed decisions with a reliable valuation tool tailored for J Sainsbury plc (SBRYL).
- Financial Analysts: Streamline your workflow with a customizable DCF model specifically for J Sainsbury plc (SBRYL).
- Consultants: Effortlessly modify the template for impactful client presentations or detailed reports on J Sainsbury plc (SBRYL).
- Finance Enthusiasts: Enhance your knowledge of valuation methods through real-world scenarios related to J Sainsbury plc (SBRYL).
- Educators and Students: Utilize it as a hands-on learning resource in finance courses focusing on J Sainsbury plc (SBRYL).
Contents of the Template
- Detailed DCF Model: An editable framework featuring thorough valuation computations.
- Real-World Data: Historical and projected financial data for J Sainsbury plc (SBRYL) preloaded for your analysis.
- Customizable Variables: Modify WACC, growth rates, and tax assumptions to explore different scenarios.
- Financial Statements: Comprehensive annual and quarterly analyses for enhanced understanding.
- Key Financial Ratios: Integrated assessments for profitability, efficiency, and leverage metrics.
- Dashboard with Visual Outputs: Illustrative charts and tables providing clear and actionable insights.
Disclaimer
All information, articles, and product details provided on this website are for general informational and educational purposes only. We do not claim any ownership over, nor do we intend to infringe upon, any trademarks, copyrights, logos, brand names, or other intellectual property mentioned or depicted on this site. Such intellectual property remains the property of its respective owners, and any references here are made solely for identification or informational purposes, without implying any affiliation, endorsement, or partnership.
We make no representations or warranties, express or implied, regarding the accuracy, completeness, or suitability of any content or products presented. Nothing on this website should be construed as legal, tax, investment, financial, medical, or other professional advice. In addition, no part of this site—including articles or product references—constitutes a solicitation, recommendation, endorsement, advertisement, or offer to buy or sell any securities, franchises, or other financial instruments, particularly in jurisdictions where such activity would be unlawful.
All content is of a general nature and may not address the specific circumstances of any individual or entity. It is not a substitute for professional advice or services. Any actions you take based on the information provided here are strictly at your own risk. You accept full responsibility for any decisions or outcomes arising from your use of this website and agree to release us from any liability in connection with your use of, or reliance upon, the content or products found herein.