
|
The Shipping Corporation of India Limited (SCI.NS): Porter's 5 Forces Analysis |
Fully Editable: Tailor To Your Needs In Excel Or Sheets
Professional Design: Trusted, Industry-Standard Templates
Investor-Approved Valuation Models
MAC/PC Compatible, Fully Unlocked
No Expertise Is Needed; Easy To Follow
The Shipping Corporation of India Limited (SCI.NS) Bundle
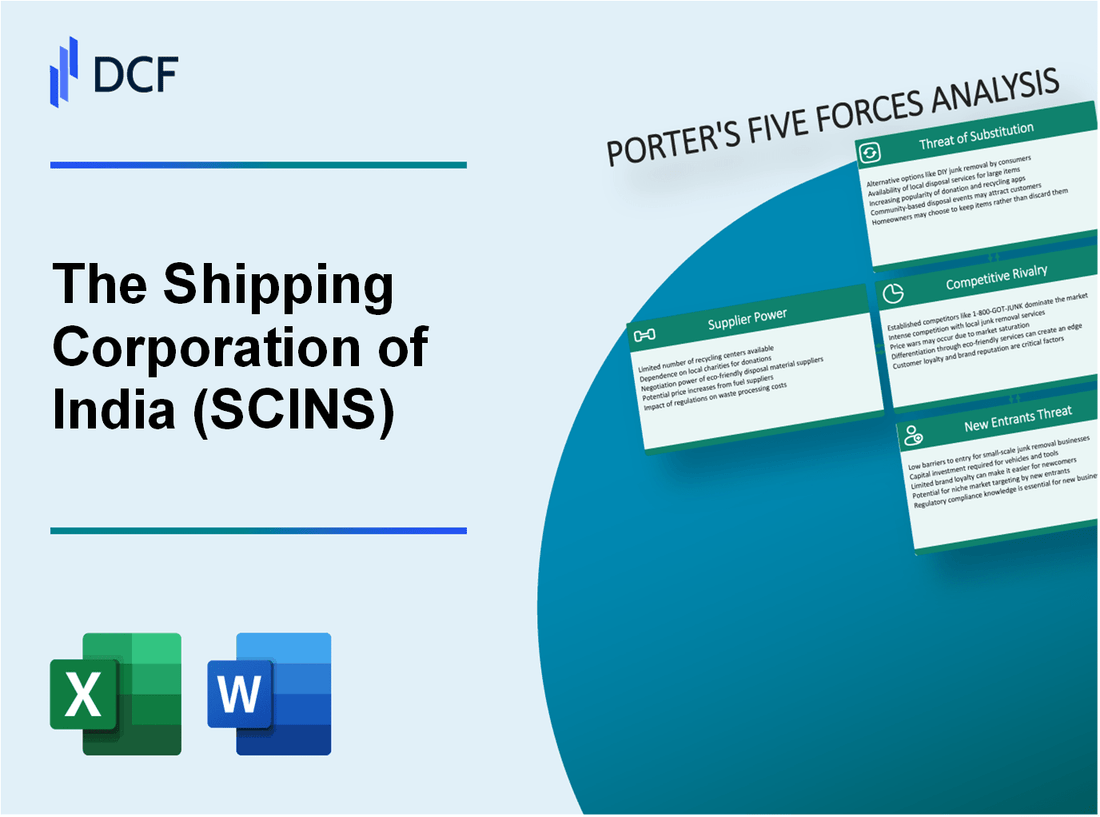
In the ever-evolving maritime landscape, The Shipping Corporation of India Limited navigates a sea of complexities driven by Michael Porter’s Five Forces Framework. From the critical role of suppliers to the fierce competition in freight rates, understanding these forces is essential for grasping the challenges and opportunities in the shipping industry. Dive in to explore how supplier dynamics, customer expectations, competitive rivalries, substitute threats, and barriers to entry shape this pivotal sector.
The Shipping Corporation of India Limited - Porter's Five Forces: Bargaining power of suppliers
The bargaining power of suppliers in the shipping industry significantly impacts The Shipping Corporation of India Limited (SCI). This power can be evaluated using several critical factors:
Limited supply of shipping vessels
The global fleet of merchant vessels has been under pressure, with the total number of vessels reaching approximately 56,000 as of 2023. The new build orders for vessels have seen a reduction of about 20% compared to the previous years, constraining the availability of new vessels. This limited supply can lead to increased costs as existing suppliers leverage their position.
High fuel and maintenance costs
As of 2023, fuel represents about 40% of the total operating costs for shipping companies. The average price of marine fuel (Bunker fuel) recently surged to approximately $600 per metric ton. Coupled with maintenance costs, which can range between $1 million to $5 million annually per vessel, these financial pressures enhance suppliers' power.
Dependency on technology providers
With the increasing focus on digital transformation within the maritime sector, SCI relies heavily on technology providers for navigational systems, fleet management, and maintenance solutions. The market for maritime technology solutions is expected to grow by 15% annually, creating dependency on a limited number of specialized tech suppliers. A few key players dominate this market, thus increasing their bargaining leverage.
Specialized workforce requirements
The maritime industry demands skilled labor, particularly in engineering, navigation, and management roles. The average annual salary for a maritime officer in India is approximately ₹1,200,000, while specialized engineers can command salaries exceeding ₹1,500,000. This skilled labor shortage results in higher recruitment costs, enhancing the bargaining power of training institutions and specialized workforce suppliers.
Limited availability of quality shipyards
India's shipbuilding capacity is limited, with only a handful of shipyards capable of meeting international standards. According to the Ministry of Shipping, only around 10 shipyards are actively engaged in new constructions. The average cost for building a new vessel in these yards can be as high as $300 million, increasing supplier power as shipping companies often have to rely on few options for quality construction.
| Factor | Current Data | Implications for Supplier Power |
|---|---|---|
| Supply of Shipping Vessels | 56,000 vessels globally; new builds down by 20% | Higher leverage for existing suppliers |
| Fuel Costs | $600 per metric ton | Increases operating costs, making supplier power stronger |
| Maintenance Costs | Annual costs between $1 million to $5 million | Higher dependency on maintenance suppliers |
| Technology Dependency | 15% annual growth in maritime technology market | Increased reliance on a few specialized technology providers |
| Skilled Labor Costs | ₹1,200,000 to ₹1,500,000 per year | Higher costs due to labor shortages |
| Quality Shipyards | 10 shipyards active in India | Limited options increase construction costs |
The Shipping Corporation of India Limited - Porter's Five Forces: Bargaining power of customers
The bargaining power of customers in the shipping industry significantly impacts The Shipping Corporation of India Limited (SCI). Various factors play a role in defining this power, particularly in terms of cost and service quality.
High demand for competitive freight rates
Competition in the shipping sector has driven freight rates down. In FY 2022-23, the average freight rate for container shipping was approximately USD 3,000 per TEU, reflecting a drop from USD 4,500 per TEU in FY 2021-22. This increasing demand for lower rates empowers customers, as they can switch providers based on price.
Availability of alternative shipping providers
Customers have access to numerous alternatives in the market. As of 2023, there are over 300 major container shipping companies globally, including Maersk, MSC, and CMA CGM. This wide availability of options heightens the customers' bargaining power, as they can easily change suppliers if their needs are not met.
Large customers can negotiate better terms
Large corporations, such as Walmart and Amazon, often represent a significant portion of shipping volume. These companies frequently negotiate contracts based on substantial freight volumes. For instance, a large client shipping volume could exceed 100,000 TEUs annually, allowing them to negotiate discounts of up to 20% on standard rates.
Need for reliable and timely services
Reliability and timeliness are crucial metrics for customers selecting shipping providers. According to the latest industry analysis, a shipping company's on-time performance is a key determinant, where providers with an on-time delivery rate above 90% are favored. The shipping industry average for on-time delivery in 2022 was reported at 86%, highlighting the need for SCI to maintain or exceed this standard to satisfy client demands.
Customer sensitivity to service quality
Customers are increasingly sensitive to service quality, which includes aspects like customer support, shipment tracking, and crisis management. A recent survey indicated that 75% of customers stated that they are likely to switch to a competitor if their service quality expectations are not met. Consequently, maintaining high service standards is essential for SCI to retain its customer base.
| Factor | Data/Impact |
|---|---|
| Average Freight Rate FY 2022-23 | USD 3,000 per TEU |
| Major Shipping Companies | Over 300 |
| Large Client Volume | Exceeds 100,000 TEUs annually |
| Typical Discount Negotiated | Up to 20% |
| On-Time Delivery Rate (Industry Standard) | 86% |
| Customer Retention Sensitivity | 75% likely to switch for poor service |
The Shipping Corporation of India Limited - Porter's Five Forces: Competitive rivalry
The shipping industry is characterized by numerous global competitors, with major players including A.P. Moller-Maersk, Mediterranean Shipping Company (MSC), and Hapag-Lloyd. According to the Alphaliner Global Top 100, as of October 2023, A.P. Moller-Maersk holds a fleet capacity of approximately 4.4 million TEUs, significantly impacting market share dynamics. The Shipping Corporation of India (SCI) operates with a much smaller fleet capacity of about 1.2 million DWT, highlighting a stark contrast in scale.
Price wars in freight charges are a common occurrence in this sector. Recent trends show that freight rates have fluctuated dramatically. For instance, the Baltic Dry Index, which measures the cost of shipping bulk commodities, reached a high of 5,600 points in May 2021 before descending to around 1,200 points in October 2023. Such fluctuations often compel companies like SCI to engage in aggressive pricing strategies to maintain competitiveness, pushing down profit margins.
Service quality has become a pivotal aspect of differentiation in the shipping sector. Companies are increasingly focusing on sustainability and customer service to gain a competitive edge. SCI has invested in digital transformation initiatives, enhancing cargo tracking and management services. For example, in FY 2022-23, SCI reported an increase in customer satisfaction scores by 12% after implementing these enhancements.
Intense competition is particularly evident in major shipping routes, such as those connecting India to Europe and Southeast Asia. In recent years, the market has seen an increase in the number of vessels deployed on key routes. The average vessel size on the India-Europe route has increased to approximately 14,000 TEUs, leading to heightened competition among carriers and consequently exerting downward pressure on rates.
Alliances and partnerships are reshaping the competitive dynamics within the industry. The formation of the 2M Alliance between Maersk and MSC has created substantial competitive pressure on companies like SCI. The 2M Alliance accounted for over 30% of the total container market capacity in 2023, which has forced smaller players to innovate and explore collaborations to improve their service offerings.
| Company | Fleet Capacity (TEUs) | Market Share (%) | Customer Satisfaction Score (FY 2022-23) |
|---|---|---|---|
| A.P. Moller-Maersk | 4,400,000 | 17.2 | - |
| Mediterranean Shipping Company (MSC) | 4,200,000 | 16.9 | - |
| Hapag-Lloyd | 1,800,000 | 7.2 | - |
| The Shipping Corporation of India | 1,200,000 | 3.0 | 87% |
The Shipping Corporation of India Limited - Porter's Five Forces: Threat of Substitutes
The threat of substitutes for The Shipping Corporation of India Limited (SCI) is influenced by several alternative transportation methods that consumers could consider depending on price, speed, and environmental impact.
Air Freight as a Faster Alternative
Air freight provides a faster means of transporting goods, especially for high-value or time-sensitive shipments. As of 2023, the global air freight market is projected to reach approximately $194.5 billion, with a projected CAGR of 4.3% from 2023 to 2030. This growth underscores the competitive pressure on maritime logistics, particularly for perishable goods or urgent deliveries.
Rail and Road Transport for Regional Shipments
For regional shipments, rail and road transport serve as viable alternatives. According to the Ministry of Railways, as of 2022, India’s freight rail network moved over 1.5 billion tons of cargo. Railways are known for lower costs in bulk shipping compared to maritime transport. Road transport also accounts for roughly 65% of India’s logistics costs, with projections estimating the Indian logistics market to reach $215 billion by 2026.
Emerging Digital Logistics Solutions
Technology is reshaping the logistics landscape, with digital solutions providing increased efficiency and transparency. Companies like Amazon and Alibaba are leading the charge in integrating advanced logistics algorithms and real-time tracking systems. The global logistics technology market size was valued at approximately $18.87 billion in 2021, expecting growth at a CAGR of 24.4% from 2022 to 2030. This shift emphasizes the growing threat to traditional shipping methods.
Shifts to More Eco-Friendly Transport Options
There is a noticeable shift toward eco-friendly transport options. For instance, the International Maritime Organization aims to reduce greenhouse gas emissions from shipping by at least 50% by 2050, fostering competition from greener alternatives. In 2022, electric vehicles accounted for 7.2% of total vehicle sales globally, signaling an increasing preference for sustainable logistics solutions.
Containerization Reducing Flexibility Barriers
Containerization has revolutionized shipping, allowing for the efficient movement of cargo. According to the World Shipping Council, container shipping represented 60% of the global seaborne trade by 2020. Despite its efficiency, it can create rigidity within logistics networks, as companies may become reliant on specific routes and schedules. Flexibility barriers from containerization could lead customers to seek alternatives if pricing becomes unfavorable.
| Transport Method | Market Size (2023) | Projected CAGR | Primary Advantage | Environmental Impact |
|---|---|---|---|---|
| Air Freight | $194.5 billion | 4.3% | Speed | High |
| Rail Transport | $215 billion (2026) | Ongoing | Cost-effective for bulk | Moderate |
| Road Transport | $215 billion (2026) | Ongoing | Flexibility for local deliveries | High |
| Logistics Tech | $18.87 billion | 24.4% | Efficiency and transparency | Variable |
| Eco-Friendly Options | Not directly measurable | Ongoing | Sustainability | Low (ideally) |
The Shipping Corporation of India Limited - Porter's Five Forces: Threat of new entrants
The threat of new entrants in the shipping industry, particularly for The Shipping Corporation of India Limited (SCI), hinges on several critical factors that uphold market stability and profitability.
High Capital Investment Required
Entering the shipping industry demands substantial initial investment. The average cost of a new bulk carrier can range from $20 million to $60 million, depending on size and specifications. These high capital requirements act as a significant barrier to entry for potential newcomers. Additionally, the operational costs, maintenance, and insurance further add to the financial burden.
Stringent Regulatory and Compliance Standards
The shipping sector is heavily regulated under various national and international frameworks, including the International Maritime Organization (IMO) regulations. Compliance with the ISM Code (International Safety Management Code) requires companies to implement rigorous safety and quality management systems, often incurring costs upwards of $1 million in compliance-related expenses for smaller firms seeking to enter the market.
Established Brand Loyalty in the Industry
Established players like SCI benefit from existing customer relationships and brand loyalty cultivated over decades. SCI holds a significant market share of around 29% in the Indian shipping sector. New entrants face challenges in competing against recognized brands, which have built trust and reliability in service delivery.
Economies of Scale Favor Existing Players
Companies in the shipping industry achieve significant cost advantages through economies of scale. For instance, SCI operates a fleet of approximately 66 ships with a total capacity of around 3.6 million DWT (Deadweight Tonnage). This scale allows SCI to lower operational costs per unit, making it difficult for smaller, new entrants to compete on pricing.
Barriers in Technology and Operational Know-How
The shipping industry requires advanced technological investments and operational expertise. For example, advanced navigation and cargo management systems can cost between $500,000 to $2 million to implement. New entrants may struggle to acquire the necessary technological capabilities and experienced personnel to effectively operate in this complex environment.
| Factor | Description | Cost Impact |
|---|---|---|
| Capital Investment | Cost of new vessels ranges from $20 million to $60 million | High |
| Regulatory Compliance | Compliance with ISM Code and other regulations | Approx. $1 million for smaller entrants |
| Brand Loyalty | SCI holds ~29% market share in Indian shipping | High barrier for new entrants |
| Economies of Scale | SCI operates a fleet of ~66 ships (~3.6 million DWT) | Lower operational costs |
| Technology & Know-How | Advanced systems costing ~$500,000 to $2 million | Requires expertise and tech investment |
In summary, the combination of high capital requirements, stringent regulations, established brand loyalty, economies of scale, and technological barriers presents a formidable challenge for new entrants attempting to penetrate the shipping industry, thereby helping maintain the profitability of established players like The Shipping Corporation of India Limited.
Understanding the dynamics of Michael Porter’s Five Forces in the context of The Shipping Corporation of India Limited provides invaluable insights into the competitive landscape and strategic positioning of the company. Each element—from supplier limitations to customer demands and competitive pressures—shapes the operational decisions that drive profitability and sustainability in an ever-evolving maritime industry.
[right_small]Disclaimer
All information, articles, and product details provided on this website are for general informational and educational purposes only. We do not claim any ownership over, nor do we intend to infringe upon, any trademarks, copyrights, logos, brand names, or other intellectual property mentioned or depicted on this site. Such intellectual property remains the property of its respective owners, and any references here are made solely for identification or informational purposes, without implying any affiliation, endorsement, or partnership.
We make no representations or warranties, express or implied, regarding the accuracy, completeness, or suitability of any content or products presented. Nothing on this website should be construed as legal, tax, investment, financial, medical, or other professional advice. In addition, no part of this site—including articles or product references—constitutes a solicitation, recommendation, endorsement, advertisement, or offer to buy or sell any securities, franchises, or other financial instruments, particularly in jurisdictions where such activity would be unlawful.
All content is of a general nature and may not address the specific circumstances of any individual or entity. It is not a substitute for professional advice or services. Any actions you take based on the information provided here are strictly at your own risk. You accept full responsibility for any decisions or outcomes arising from your use of this website and agree to release us from any liability in connection with your use of, or reliance upon, the content or products found herein.