
|
SCOR SE (SCR.PA) DCF Valuation |
Fully Editable: Tailor To Your Needs In Excel Or Sheets
Professional Design: Trusted, Industry-Standard Templates
Investor-Approved Valuation Models
MAC/PC Compatible, Fully Unlocked
No Expertise Is Needed; Easy To Follow
SCOR SE (SCR.PA) Bundle
Designed for accuracy, our SCOR SE (SCRPA) DCF Calculator enables you to assess the valuation of SCOR SE using actual financial data, offering complete flexibility to modify all essential parameters for enhanced projections.
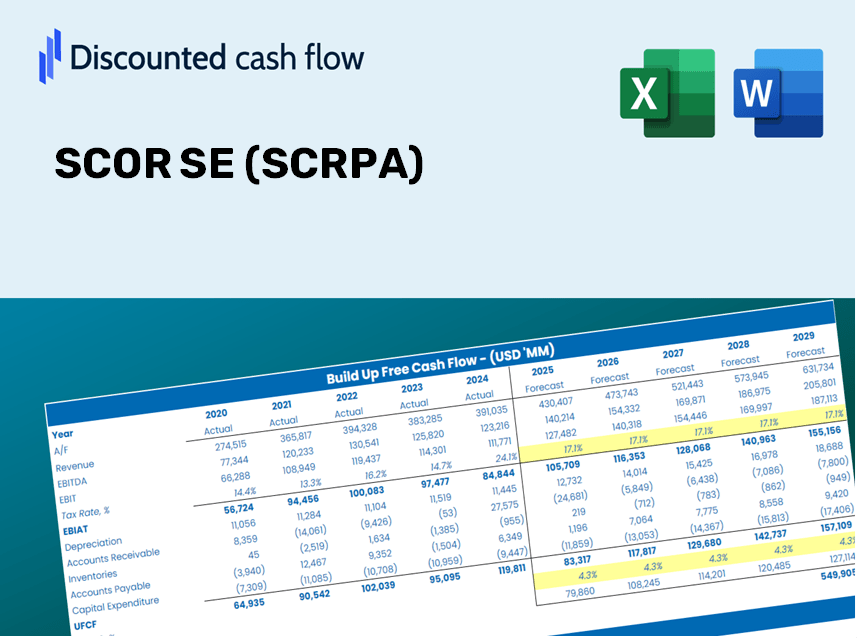
Discounted Cash Flow (DCF) - (USD MM)
| Year | AY1 2020 |
AY2 2021 |
AY3 2022 |
AY4 2023 |
AY5 2024 |
FY1 2025 |
FY2 2026 |
FY3 2027 |
FY4 2028 |
FY5 2029 |
|---|---|---|---|---|---|---|---|---|---|---|
| Revenue | 15,423.0 | 16,034.0 | 3,328.0 | 16,265.0 | 12,996.0 | 13,146.1 | 13,297.9 | 13,451.4 | 13,606.8 | 13,763.9 |
| Revenue Growth, % | 0 | 3.96 | -79.24 | 388.73 | -20.1 | 1.15 | 1.15 | 1.15 | 1.15 | 1.15 |
| EBITDA | 560.0 | 884.0 | -1,416.0 | 1,588.0 | 520.0 | -516.4 | -522.3 | -528.4 | -534.5 | -540.6 |
| EBITDA, % | 3.63 | 5.51 | -42.55 | 9.76 | 4 | -3.93 | -3.93 | -3.93 | -3.93 | -3.93 |
| Depreciation | 81.0 | 94.0 | 100.0 | 211.0 | 223.0 | 187.4 | 189.6 | 191.8 | 194.0 | 196.3 |
| Depreciation, % | 0.52519 | 0.58625 | 3 | 1.3 | 1.72 | 1.43 | 1.43 | 1.43 | 1.43 | 1.43 |
| EBIT | 479.0 | 790.0 | -1,516.0 | 1,377.0 | 297.0 | -703.8 | -711.9 | -720.2 | -728.5 | -736.9 |
| EBIT, % | 3.11 | 4.93 | -45.55 | 8.47 | 2.29 | -5.35 | -5.35 | -5.35 | -5.35 | -5.35 |
| Total Cash | 1,804.0 | 2,083.0 | 1,830.0 | 20,902.0 | 22,077.0 | 7,353.3 | 7,438.2 | 7,524.1 | 7,611.0 | 7,698.9 |
| Total Cash, percent | .0 | .0 | .0 | .0 | .0 | .0 | .0 | .0 | .0 | .0 |
| Account Receivables | .0 | .0 | .0 | .0 | .0 | .0 | .0 | .0 | .0 | .0 |
| Account Receivables, % | 0 | 0 | 0 | 0 | 0 | 0 | 0 | 0 | 0 | 0 |
| Inventories | .0 | .0 | .0 | .0 | .0 | .0 | .0 | .0 | .0 | .0 |
| Inventories, % | 0 | 0 | 0 | 0 | 0 | 0 | 0 | 0 | 0 | 0 |
| Accounts Payable | 1,940.0 | 3,097.0 | 154.0 | .0 | .0 | 960.2 | 971.3 | 982.5 | 993.9 | 1,005.3 |
| Accounts Payable, % | 12.58 | 19.32 | 4.63 | 0 | 0 | 7.3 | 7.3 | 7.3 | 7.3 | 7.3 |
| Capital Expenditure | -135.0 | -87.0 | -70.0 | -33.0 | -8.0 | -99.5 | -100.7 | -101.8 | -103.0 | -104.2 |
| Capital Expenditure, % | -0.87532 | -0.5426 | -2.1 | -0.20289 | -0.0615574 | -0.75715 | -0.75715 | -0.75715 | -0.75715 | -0.75715 |
| Tax Rate, % | 97.74 | 97.74 | 97.74 | 97.74 | 97.74 | 97.74 | 97.74 | 97.74 | 97.74 | 97.74 |
| EBITAT | 333.6 | 543.3 | -3,946.8 | 891.6 | 6.7 | -429.9 | -434.9 | -439.9 | -445.0 | -450.1 |
| Depreciation | ||||||||||
| Changes in Account Receivables | ||||||||||
| Changes in Inventories | ||||||||||
| Changes in Accounts Payable | ||||||||||
| Capital Expenditure | ||||||||||
| UFCF | 2,219.6 | 1,707.3 | -6,859.8 | 915.6 | 221.7 | 618.2 | -334.9 | -338.7 | -342.7 | -346.6 |
| WACC, % | 5.75 | 5.74 | 6.18 | 5.68 | 4.8 | 5.63 | 5.63 | 5.63 | 5.63 | 5.63 |
| PV UFCF | ||||||||||
| SUM PV UFCF | -541.1 | |||||||||
| Long Term Growth Rate, % | 2.00 | |||||||||
| Free cash flow (T + 1) | -354 | |||||||||
| Terminal Value | -9,738 | |||||||||
| Present Terminal Value | -7,405 | |||||||||
| Enterprise Value | -7,946 | |||||||||
| Net Debt | 1,167 | |||||||||
| Equity Value | -9,113 | |||||||||
| Diluted Shares Outstanding, MM | 182 | |||||||||
| Equity Value Per Share | -50.09 |
What You Will Receive
- Authentic SCRPA Financial Data: Pre-loaded with SCOR SE's historical and forecasted data for accurate analysis.
- Completely Customizable Template: Easily adjust crucial inputs such as revenue growth, WACC, and EBITDA percentage.
- Instant Calculations: Watch SCOR SE’s intrinsic value change in real-time as you modify inputs.
- Expert Valuation Tool: Tailored for investors, analysts, and consultants seeking reliable DCF outcomes.
- Intuitive Design: Straightforward layout and clear guidance suitable for all skill levels.
Key Features
- 🔍 Real-Life SCOR Financials: Pre-filled historical and projected data for SCOR SE (SCRPA).
- ✏️ Fully Customizable Inputs: Modify all essential parameters (yellow cells) such as WACC, growth %, and tax rates.
- 📊 Professional DCF Valuation: Integrated formulas calculate SCOR's intrinsic value using the Discounted Cash Flow approach.
- ⚡ Instant Results: View SCOR's valuation immediately after making adjustments.
- Scenario Analysis: Evaluate and compare outcomes for different financial assumptions side-by-side.
How It Functions
- Step 1: Download the Excel file.
- Step 2: Examine the pre-filled financial data and forecasts for SCOR SE (SCRPA).
- Step 3: Adjust essential inputs such as revenue growth, WACC, and tax rates (highlighted cells).
- Step 4: Observe the DCF model updating in real-time as you modify your assumptions.
- Step 5: Assess the outputs and leverage the results to inform your investment decisions.
Why Opt for the SCOR SE (SCRPA) Calculator?
- Time-Saving: Skip the hassle of building a DCF model from the ground up – it's immediately available for use.
- Enhanced Accuracy: Dependable financial data and formulas minimize valuation errors.
- Fully Customizable: Adjust the model to fit your specific assumptions and forecasts.
- Easy to Understand: Intuitive charts and outputs facilitate straightforward analysis of the results.
- Endorsed by Professionals: Crafted for experts who prioritize both precision and ease of use.
Who Can Benefit from This Product?
- Finance Students: Acquire essential valuation skills and practice with actual data.
- Researchers: Utilize industry-standard models in your academic studies or research projects.
- Investors: Validate your investment strategies and assess valuation metrics for SCOR SE (SCRPA).
- Financial Analysts: Enhance your productivity with a ready-to-use and customizable DCF model.
- Small Business Owners: Understand the analytical approaches used for evaluating major public companies like SCOR SE (SCRPA).
What the Template Includes
- Pre-Filled DCF Model: SCOR SE’s financial data ready for immediate analysis.
- WACC Calculator: Comprehensive calculations for Weighted Average Cost of Capital.
- Financial Ratios: Assess SCOR SE’s profitability, leverage, and operational efficiency.
- Editable Inputs: Modify assumptions like growth rates, margins, and CAPEX to suit your models.
- Financial Statements: Annual and quarterly reports available for in-depth evaluation.
- Interactive Dashboard: Effortlessly visualize crucial valuation metrics and outcomes.
Disclaimer
All information, articles, and product details provided on this website are for general informational and educational purposes only. We do not claim any ownership over, nor do we intend to infringe upon, any trademarks, copyrights, logos, brand names, or other intellectual property mentioned or depicted on this site. Such intellectual property remains the property of its respective owners, and any references here are made solely for identification or informational purposes, without implying any affiliation, endorsement, or partnership.
We make no representations or warranties, express or implied, regarding the accuracy, completeness, or suitability of any content or products presented. Nothing on this website should be construed as legal, tax, investment, financial, medical, or other professional advice. In addition, no part of this site—including articles or product references—constitutes a solicitation, recommendation, endorsement, advertisement, or offer to buy or sell any securities, franchises, or other financial instruments, particularly in jurisdictions where such activity would be unlawful.
All content is of a general nature and may not address the specific circumstances of any individual or entity. It is not a substitute for professional advice or services. Any actions you take based on the information provided here are strictly at your own risk. You accept full responsibility for any decisions or outcomes arising from your use of this website and agree to release us from any liability in connection with your use of, or reliance upon, the content or products found herein.