
|
Sezzle Inc. (SEZL) DCF Valuation |
Fully Editable: Tailor To Your Needs In Excel Or Sheets
Professional Design: Trusted, Industry-Standard Templates
Investor-Approved Valuation Models
MAC/PC Compatible, Fully Unlocked
No Expertise Is Needed; Easy To Follow
Sezzle Inc. (SEZL) Bundle
Looking to assess Sezzle Inc.'s (SEZL) intrinsic value? Our (SEZL) DCF Calculator integrates real-world data with extensive customization features, enabling you to refine your forecasts and enhance your investment choices.
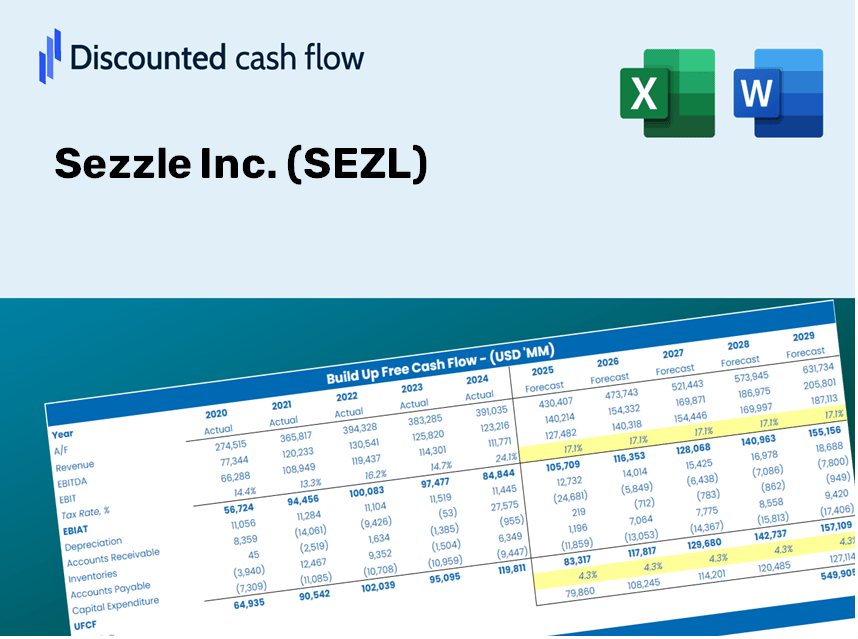
Discounted Cash Flow (DCF) - (USD MM)
| Year | AY1 2020 |
AY2 2021 |
AY3 2022 |
AY4 2023 |
AY5 2024 |
FY1 2025 |
FY2 2026 |
FY3 2027 |
FY4 2028 |
FY5 2029 |
|---|---|---|---|---|---|---|---|---|---|---|
| Revenue | 58.8 | .0 | 125.6 | 159.4 | 271.1 | 269.1 | 267.1 | 265.2 | 263.2 | 261.3 |
| Revenue Growth, % | 0 | -100 | 0 | 26.91 | 70.14 | -0.7387 | -0.7387 | -0.7387 | -0.7387 | -0.7387 |
| EBITDA | -28.1 | -69.1 | -28.6 | 24.5 | 82.0 | 40.5 | 40.2 | 39.9 | 39.6 | 39.3 |
| EBITDA, % | -47.73 | 100 | -22.76 | 15.4 | 30.26 | 15.03 | 15.03 | 15.03 | 15.03 | 15.03 |
| Depreciation | .0 | .7 | .8 | .9 | 1.0 | 54.7 | 54.3 | 53.9 | 53.5 | 53.1 |
| Depreciation, % | 0 | 100 | 0.67462 | 0.53704 | 0.35607 | 20.31 | 20.31 | 20.31 | 20.31 | 20.31 |
| EBIT | -28.1 | -69.8 | -29.4 | 23.7 | 81.1 | 39.6 | 39.3 | 39.0 | 38.7 | 38.5 |
| EBIT, % | -47.73 | 100 | -23.43 | 14.86 | 29.9 | 14.72 | 14.72 | 14.72 | 14.72 | 14.72 |
| Total Cash | 84.3 | 77.0 | 68.3 | 67.6 | 73.2 | 174.3 | 173.0 | 171.7 | 170.5 | 169.2 |
| Total Cash, percent | .0 | .0 | .0 | .0 | .0 | .0 | .0 | .0 | .0 | .0 |
| Account Receivables | 82.2 | 139.1 | 95.9 | 132.2 | 168.2 | 226.8 | 225.1 | 223.5 | 221.8 | 220.2 |
| Account Receivables, % | 139.84 | 100 | 76.36 | 82.96 | 62.03 | 84.27 | 84.27 | 84.27 | 84.27 | 84.27 |
| Inventories | .0 | .0 | .0 | .0 | .0 | 53.8 | 53.4 | 53.0 | 52.6 | 52.3 |
| Inventories, % | 0 | 100 | 0 | 0 | 0 | 20 | 20 | 20 | 20 | 20 |
| Accounts Payable | 60.9 | 96.5 | 83.0 | 74.1 | 69.0 | 182.0 | 180.6 | 179.3 | 178.0 | 176.7 |
| Accounts Payable, % | 103.65 | 100 | 66.11 | 46.52 | 25.44 | 67.61 | 67.61 | 67.61 | 67.61 | 67.61 |
| Capital Expenditure | -.6 | -1.0 | -1.0 | -1.4 | -1.5 | -1.7 | -1.7 | -1.7 | -1.7 | -1.6 |
| Capital Expenditure, % | -0.95745 | 100 | -0.8028 | -0.85694 | -0.53995 | -0.63143 | -0.63143 | -0.63143 | -0.63143 | -0.63143 |
| Tax Rate, % | -16.65 | -16.65 | -16.65 | -16.65 | -16.65 | -16.65 | -16.65 | -16.65 | -16.65 | -16.65 |
| EBITAT | -28.1 | -69.9 | -29.5 | 21.8 | 94.6 | 39.0 | 38.7 | 38.4 | 38.1 | 37.8 |
| Depreciation | ||||||||||
| Changes in Account Receivables | ||||||||||
| Changes in Inventories | ||||||||||
| Changes in Accounts Payable | ||||||||||
| Capital Expenditure | ||||||||||
| UFCF | -49.9 | -91.5 | .0 | -23.9 | 52.9 | 92.5 | 92.0 | 91.3 | 90.7 | 90.0 |
| WACC, % | 43.05 | 43.05 | 43.05 | 42.99 | 43.05 | 43.03 | 43.03 | 43.03 | 43.03 | 43.03 |
| PV UFCF | ||||||||||
| SUM PV UFCF | 177.6 | |||||||||
| Long Term Growth Rate, % | 2.00 | |||||||||
| Free cash flow (T + 1) | 92 | |||||||||
| Terminal Value | 224 | |||||||||
| Present Terminal Value | 37 | |||||||||
| Enterprise Value | 215 | |||||||||
| Net Debt | 32 | |||||||||
| Equity Value | 183 | |||||||||
| Diluted Shares Outstanding, MM | 36 | |||||||||
| Equity Value Per Share | 5.10 |
What You Will Receive
- Accurate SEZL Financial Data: Features both historical and projected figures for reliable valuation.
- Customizable Parameters: Adjust key inputs like WACC, tax rates, revenue growth, and capital expenditures.
- Instant Calculations: Automatically calculates intrinsic value and NPV in real-time.
- Scenario Exploration: Assess various scenarios to analyze Sezzle’s potential future outcomes.
- User-Friendly Interface: Designed for finance professionals while remaining accessible to newcomers.
Key Features
- Real-Time SEZL Data: Pre-loaded with Sezzle Inc.’s historical financial figures and upcoming projections.
- Completely Customizable Inputs: Modify revenue growth rates, profit margins, WACC, tax rates, and capital expenditures.
- Dynamic Valuation Framework: Automatic recalculations of Net Present Value (NPV) and intrinsic value based on your adjustments.
- Scenario Analysis: Develop various forecasting scenarios to explore different valuation possibilities.
- User-Centric Interface: Intuitive, organized, and suitable for both professionals and newcomers.
How It Operates
- Download: Obtain the pre-prepared Excel file featuring Sezzle Inc.'s (SEZL) financial data.
- Customize: Modify forecasts such as revenue growth, EBITDA %, and WACC to suit your analysis.
- Update Automatically: Watch as the intrinsic value and NPV calculations refresh in real-time.
- Test Scenarios: Develop various projections and instantly compare the results.
- Make Decisions: Leverage the valuation findings to inform your investment approach.
Why Opt for the Sezzle Inc. (SEZL) Calculator?
- Time-Saving: Skip the hassle of building a discounted cash flow model from the ground up – it's ready for immediate use.
- Enhanced Accuracy: Dependable financial data and proven formulas minimize valuation errors.
- Fully Adaptable: Customize the model to align with your specific assumptions and forecasts.
- User-Friendly: Intuitive charts and outputs simplify result interpretation.
- Expert Approved: Crafted for professionals who prioritize accuracy and ease of use.
Who Should Benefit from Sezzle Inc. (SEZL)?
- Professional Investors: Develop comprehensive and trustworthy valuation models for investment assessments.
- Corporate Finance Teams: Evaluate valuation scenarios to shape strategic decisions within the organization.
- Consultants and Advisors: Deliver precise valuation insights to clients regarding Sezzle Inc. (SEZL).
- Students and Educators: Utilize real-time data to practice and impart financial modeling skills.
- Fintech Enthusiasts: Explore how fintech companies like Sezzle Inc. (SEZL) are appraised in the marketplace.
Contents of the Template
- Operating and Balance Sheet Data: Pre-filled historical data and forecasts for Sezzle Inc. (SEZL), including revenue, EBITDA, EBIT, and capital expenditures.
- WACC Calculation: A dedicated sheet for calculating the Weighted Average Cost of Capital (WACC), featuring essential parameters like Beta, risk-free rate, and share price.
- DCF Valuation (Unlevered and Levered): Editable Discounted Cash Flow models illustrating intrinsic value with comprehensive calculations.
- Financial Statements: Pre-loaded annual and quarterly financial statements for Sezzle Inc. (SEZL) to support detailed analysis.
- Key Ratios: Contains profitability, leverage, and efficiency ratios relevant to Sezzle Inc. (SEZL).
- Dashboard and Charts: A visual summary of valuation outputs and underlying assumptions to facilitate result analysis.
Disclaimer
All information, articles, and product details provided on this website are for general informational and educational purposes only. We do not claim any ownership over, nor do we intend to infringe upon, any trademarks, copyrights, logos, brand names, or other intellectual property mentioned or depicted on this site. Such intellectual property remains the property of its respective owners, and any references here are made solely for identification or informational purposes, without implying any affiliation, endorsement, or partnership.
We make no representations or warranties, express or implied, regarding the accuracy, completeness, or suitability of any content or products presented. Nothing on this website should be construed as legal, tax, investment, financial, medical, or other professional advice. In addition, no part of this site—including articles or product references—constitutes a solicitation, recommendation, endorsement, advertisement, or offer to buy or sell any securities, franchises, or other financial instruments, particularly in jurisdictions where such activity would be unlawful.
All content is of a general nature and may not address the specific circumstances of any individual or entity. It is not a substitute for professional advice or services. Any actions you take based on the information provided here are strictly at your own risk. You accept full responsibility for any decisions or outcomes arising from your use of this website and agree to release us from any liability in connection with your use of, or reliance upon, the content or products found herein.