
|
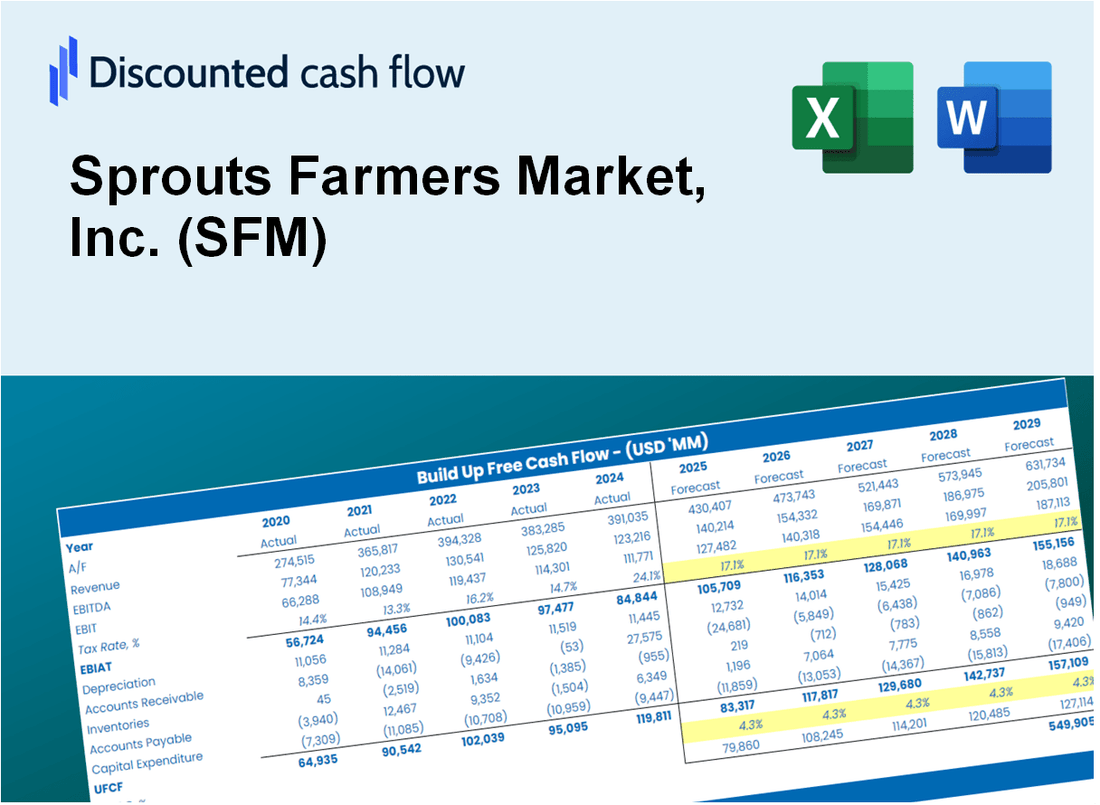
Sprouts Farmers Market, Inc. (SFM) DCF Valuation |
Fully Editable: Tailor To Your Needs In Excel Or Sheets
Professional Design: Trusted, Industry-Standard Templates
Investor-Approved Valuation Models
MAC/PC Compatible, Fully Unlocked
No Expertise Is Needed; Easy To Follow
Sprouts Farmers Market, Inc. (SFM) Bundle
Optimize your time and improve precision with our (SFM) DCF Calculator! Equipped with real data from Sprouts Farmers Market and customizable assumptions, this tool empowers you to forecast, analyze, and value Sprouts Farmers Market, Inc. like a seasoned investor.
What You Will Get
- Pre-Filled Financial Model: Sprouts Farmers Market's (SFM) actual data facilitates accurate DCF valuation.
- Full Forecast Control: Modify revenue growth, profit margins, WACC, and other essential drivers.
- Instant Calculations: Real-time updates allow you to see results as you adjust inputs.
- Investor-Ready Template: A polished Excel file crafted for high-quality valuation.
- Customizable and Reusable: Designed for adaptability, enabling repeated use for comprehensive forecasts.
Key Features
- Genuine Financial Insights: Obtain reliable pre-loaded historical data and future forecasts for Sprouts Farmers Market, Inc. (SFM).
- Tailored Forecast Parameters: Modify highlighted cells such as WACC, growth rates, and profit margins to suit your analysis.
- Real-Time Calculations: Automatic adjustments to DCF, Net Present Value (NPV), and cash flow assessments.
- Interactive Dashboard: User-friendly charts and summaries to help visualize your valuation outcomes.
- Designed for All Skill Levels: An intuitive layout catering to investors, CFOs, and consultants, whether novice or expert.
How It Works
- Download: Get the ready-to-use Excel file featuring Sprouts Farmers Market, Inc.'s (SFM) financial data.
- Customize: Modify projections, such as sales growth, operating margin, and discount rate.
- Update Automatically: The intrinsic value and NPV calculations refresh in real-time.
- Test Scenarios: Develop various projections and instantly compare results.
- Make Decisions: Leverage the valuation insights to inform your investment approach.
Why Choose This Calculator for Sprouts Farmers Market, Inc. (SFM)?
- Designed for Industry Experts: A sophisticated tool tailored for analysts, finance managers, and market consultants.
- Comprehensive Data: Sprouts' historical and projected financials preloaded for enhanced precision.
- Flexible Scenario Analysis: Effortlessly test various forecasts and assumptions to gauge potential outcomes.
- Transparent Results: Instantly computes intrinsic value, NPV, and other essential financial metrics.
- User-Friendly Interface: Detailed, step-by-step instructions ensure a smooth experience.
Who Should Use This Product?
- Individual Investors: Make informed decisions about buying or selling Sprouts Farmers Market stock (SFM).
- Financial Analysts: Streamline valuation processes with ready-to-use financial models specific to Sprouts Farmers Market (SFM).
- Consultants: Deliver professional valuation insights related to Sprouts Farmers Market (SFM) to clients quickly and accurately.
- Business Owners: Understand how grocery retailers like Sprouts Farmers Market (SFM) are valued to inform your own business strategy.
- Finance Students: Learn valuation techniques using real-world data and scenarios from Sprouts Farmers Market (SFM).
What the Template Contains
- Comprehensive DCF Model: Editable template featuring detailed valuation calculations tailored for Sprouts Farmers Market, Inc. (SFM).
- Real-World Data: Sprouts Farmers Market’s historical and projected financials preloaded for in-depth analysis.
- Customizable Parameters: Modify WACC, growth rates, and tax assumptions to explore various scenarios.
- Financial Statements: Complete annual and quarterly breakdowns for enhanced insights into the company's performance.
- Key Ratios: Integrated analysis for assessing profitability, efficiency, and leverage metrics.
- Dashboard with Visual Outputs: Engaging charts and tables that present clear, actionable results.
Disclaimer
All information, articles, and product details provided on this website are for general informational and educational purposes only. We do not claim any ownership over, nor do we intend to infringe upon, any trademarks, copyrights, logos, brand names, or other intellectual property mentioned or depicted on this site. Such intellectual property remains the property of its respective owners, and any references here are made solely for identification or informational purposes, without implying any affiliation, endorsement, or partnership.
We make no representations or warranties, express or implied, regarding the accuracy, completeness, or suitability of any content or products presented. Nothing on this website should be construed as legal, tax, investment, financial, medical, or other professional advice. In addition, no part of this site—including articles or product references—constitutes a solicitation, recommendation, endorsement, advertisement, or offer to buy or sell any securities, franchises, or other financial instruments, particularly in jurisdictions where such activity would be unlawful.
All content is of a general nature and may not address the specific circumstances of any individual or entity. It is not a substitute for professional advice or services. Any actions you take based on the information provided here are strictly at your own risk. You accept full responsibility for any decisions or outcomes arising from your use of this website and agree to release us from any liability in connection with your use of, or reliance upon, the content or products found herein.