
|
Shakti Pumps Limited (SHAKTIPUMP.NS) DCF Valuation |
Fully Editable: Tailor To Your Needs In Excel Or Sheets
Professional Design: Trusted, Industry-Standard Templates
Investor-Approved Valuation Models
MAC/PC Compatible, Fully Unlocked
No Expertise Is Needed; Easy To Follow
Shakti Pumps (India) Limited (SHAKTIPUMP.NS) Bundle
Looking to assess the intrinsic value of Shakti Pumps (India) Limited? Our (SHAKTIPUMPNS) DCF Calculator integrates real-world data with comprehensive customization features, enabling you to refine your forecasts and enhance your investment strategies.
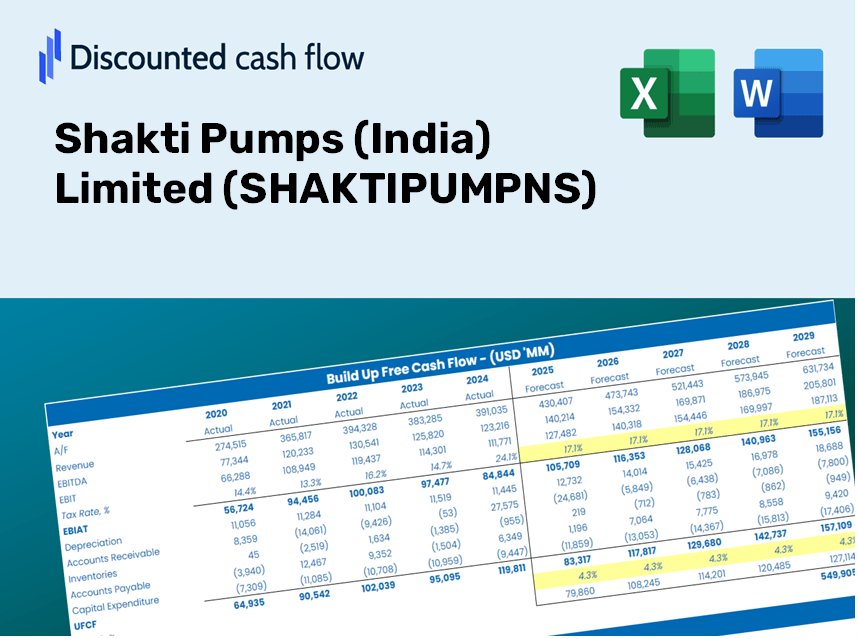
Discounted Cash Flow (DCF) - (USD MM)
| Year | AY1 2021 |
AY2 2022 |
AY3 2023 |
AY4 2024 |
AY5 2025 |
FY1 2026 |
FY2 2027 |
FY3 2028 |
FY4 2029 |
FY5 2030 |
|---|---|---|---|---|---|---|---|---|---|---|
| Revenue | 9,296.6 | 11,814.3 | 9,701.1 | 13,716.4 | 25,178.0 | 33,621.9 | 44,897.5 | 59,954.6 | 80,061.4 | 106,911.3 |
| Revenue Growth, % | 0 | 27.08 | -17.89 | 41.39 | 83.56 | 33.54 | 33.54 | 33.54 | 33.54 | 33.54 |
| EBITDA | 1,418.5 | 1,131.1 | 686.7 | 2,249.4 | 6,036.2 | 4,860.7 | 6,490.8 | 8,667.6 | 11,574.5 | 15,456.2 |
| EBITDA, % | 15.26 | 9.57 | 7.08 | 16.4 | 23.97 | 14.46 | 14.46 | 14.46 | 14.46 | 14.46 |
| Depreciation | 180.3 | 182.2 | 179.7 | 182.3 | 191.0 | 499.1 | 666.4 | 889.9 | 1,188.4 | 1,586.9 |
| Depreciation, % | 1.94 | 1.54 | 1.85 | 1.33 | 0.7586 | 1.48 | 1.48 | 1.48 | 1.48 | 1.48 |
| EBIT | 1,238.2 | 948.9 | 507.0 | 2,067.1 | 5,845.2 | 4,361.6 | 5,824.4 | 7,777.7 | 10,386.1 | 13,869.2 |
| EBIT, % | 13.32 | 8.03 | 5.23 | 15.07 | 23.22 | 12.97 | 12.97 | 12.97 | 12.97 | 12.97 |
| Total Cash | 413.0 | 444.2 | 172.1 | 2,011.3 | 1,694.2 | 2,109.3 | 2,816.7 | 3,761.4 | 5,022.8 | 6,707.3 |
| Total Cash, percent | .0 | .0 | .0 | .0 | .0 | .0 | .0 | .0 | .0 | .0 |
| Account Receivables | 3,145.9 | 3,827.8 | 2,948.6 | 6,668.4 | 10,486.8 | 12,567.8 | 16,782.7 | 22,411.0 | 29,926.9 | 39,963.4 |
| Account Receivables, % | 33.84 | 32.4 | 30.39 | 48.62 | 41.65 | 37.38 | 37.38 | 37.38 | 37.38 | 37.38 |
| Inventories | 1,334.1 | 2,158.3 | 2,073.0 | 2,976.0 | 3,419.7 | 6,002.6 | 8,015.6 | 10,703.8 | 14,293.5 | 19,087.1 |
| Inventories, % | 14.35 | 18.27 | 21.37 | 21.7 | 13.58 | 17.85 | 17.85 | 17.85 | 17.85 | 17.85 |
| Accounts Payable | 1,842.0 | 2,839.9 | 1,269.5 | 4,340.7 | 4,639.8 | 7,195.8 | 9,609.1 | 12,831.7 | 17,135.0 | 22,881.5 |
| Accounts Payable, % | 19.81 | 24.04 | 13.09 | 31.65 | 18.43 | 21.4 | 21.4 | 21.4 | 21.4 | 21.4 |
| Capital Expenditure | -132.3 | -216.2 | -248.2 | -588.3 | -1,077.8 | -967.0 | -1,291.3 | -1,724.4 | -2,302.7 | -3,075.0 |
| Capital Expenditure, % | -1.42 | -1.83 | -2.56 | -4.29 | -4.28 | -2.88 | -2.88 | -2.88 | -2.88 | -2.88 |
| Tax Rate, % | 26.53 | 26.53 | 26.53 | 26.53 | 26.53 | 26.53 | 26.53 | 26.53 | 26.53 | 26.53 |
| EBITAT | 841.3 | 747.0 | 379.4 | 1,542.8 | 4,294.7 | 3,224.1 | 4,305.4 | 5,749.3 | 7,677.4 | 10,252.2 |
| Depreciation | ||||||||||
| Changes in Account Receivables | ||||||||||
| Changes in Inventories | ||||||||||
| Changes in Accounts Payable | ||||||||||
| Capital Expenditure | ||||||||||
| UFCF | -1,748.6 | 204.8 | -295.1 | -414.8 | -555.1 | 648.3 | -134.1 | -179.1 | -239.2 | -319.4 |
| WACC, % | 4.76 | 4.81 | 4.79 | 4.79 | 4.79 | 4.79 | 4.79 | 4.79 | 4.79 | 4.79 |
| PV UFCF | ||||||||||
| SUM PV UFCF | -110.2 | |||||||||
| Long Term Growth Rate, % | 4.00 | |||||||||
| Free cash flow (T + 1) | -332 | |||||||||
| Terminal Value | -42,124 | |||||||||
| Present Terminal Value | -33,339 | |||||||||
| Enterprise Value | -33,450 | |||||||||
| Net Debt | 3 | |||||||||
| Equity Value | -33,453 | |||||||||
| Diluted Shares Outstanding, MM | 120 | |||||||||
| Equity Value Per Share | -278.27 |
What You Will Receive
- Genuine Shakti Pumps Data: Comprehensive financials – from revenue to EBIT – derived from actual and projected figures.
- Complete Customization: Modify all essential parameters (yellow cells) such as WACC, growth %, and tax rates.
- Real-Time Valuation Updates: Automatic recalculations to assess the effects of changes on Shakti Pumps' fair value.
- Adaptable Excel Template: Designed for quick modifications, scenario analyses, and in-depth projections.
- Efficient and Precise: Eliminate the need to build models from the ground up while ensuring accuracy and adaptability.
Key Features
- 🔍 Real-Life SHAKTIPUMPNS Financials: Pre-filled historical and projected data for Shakti Pumps (India) Limited.
- ✏️ Fully Customizable Inputs: Tailor all essential parameters (yellow cells) such as WACC, growth %, and tax rates.
- 📊 Professional DCF Valuation: Integrated formulas calculate the intrinsic value of Shakti Pumps using the Discounted Cash Flow method.
- ⚡ Instant Results: Immediately visualize Shakti Pumps' valuation after making adjustments.
- Scenario Analysis: Evaluate and compare results for different financial assumptions side-by-side.
How It Works
- Step 1: Download the prebuilt Excel template containing Shakti Pumps’ data.
- Step 2: Examine the pre-filled sheets to grasp key performance metrics.
- Step 3: Update forecasts and assumptions in the editable yellow cells (WACC, growth rates, margins).
- Step 4: Instantly view the recalibrated results, including Shakti Pumps' intrinsic value.
- Step 5: Make well-informed investment decisions or generate reports using the results.
Why Opt for This Calculator?
- Designed for Experts: A sophisticated tool favored by analysts, CFOs, and industry consultants.
- Accurate Data: Shakti Pumps' historical and anticipated financials come preloaded for precision.
- Flexible Scenario Analysis: Effortlessly model various forecasts and assumptions.
- Transparent Results: Instantly computes intrinsic value, NPV, and essential metrics.
- User-Friendly: Comprehensive step-by-step guidance to assist you throughout the process.
Who Can Benefit from Shakti Pumps (India) Limited (SHAKTIPUMPNS)?
- Investors: Gain confidence in your investment choices by utilizing our professional-grade valuation tool.
- Financial Analysts: Streamline your workflow with an easily customizable pre-built DCF model.
- Consultants: Effortlessly tailor the template for impactful client presentations and reports.
- Finance Enthusiasts: Enhance your knowledge of valuation strategies through real-world application.
- Educators and Students: Leverage this tool as a hands-on resource for finance-related coursework.
Contents of the Template
- Pre-Filled Data: Features Shakti Pumps' historical financial data and projections.
- Discounted Cash Flow Model: An editable DCF valuation model with automatic calculation functions.
- Weighted Average Cost of Capital (WACC): A specific sheet for WACC calculation using tailored inputs.
- Key Financial Ratios: Evaluate Shakti Pumps' profitability, efficiency, and financial leverage.
- Customizable Inputs: Easily modify revenue growth rates, margins, and tax assumptions.
- Clear Dashboard: Visual representations and tables summarizing key valuation outcomes.
Disclaimer
All information, articles, and product details provided on this website are for general informational and educational purposes only. We do not claim any ownership over, nor do we intend to infringe upon, any trademarks, copyrights, logos, brand names, or other intellectual property mentioned or depicted on this site. Such intellectual property remains the property of its respective owners, and any references here are made solely for identification or informational purposes, without implying any affiliation, endorsement, or partnership.
We make no representations or warranties, express or implied, regarding the accuracy, completeness, or suitability of any content or products presented. Nothing on this website should be construed as legal, tax, investment, financial, medical, or other professional advice. In addition, no part of this site—including articles or product references—constitutes a solicitation, recommendation, endorsement, advertisement, or offer to buy or sell any securities, franchises, or other financial instruments, particularly in jurisdictions where such activity would be unlawful.
All content is of a general nature and may not address the specific circumstances of any individual or entity. It is not a substitute for professional advice or services. Any actions you take based on the information provided here are strictly at your own risk. You accept full responsibility for any decisions or outcomes arising from your use of this website and agree to release us from any liability in connection with your use of, or reliance upon, the content or products found herein.