
|
Shriram Finance Limited (SHRIRAMFIN.NS) DCF Valuation |
Fully Editable: Tailor To Your Needs In Excel Or Sheets
Professional Design: Trusted, Industry-Standard Templates
Investor-Approved Valuation Models
MAC/PC Compatible, Fully Unlocked
No Expertise Is Needed; Easy To Follow
Shriram Finance Limited (SHRIRAMFIN.NS) Bundle
Discover the true worth of Shriram Finance Limited with our professional-grade DCF Calculator! Adjust key assumptions, explore various scenarios, and evaluate how changes influence Shriram Finance Limited’s valuation – all within a single Excel template.
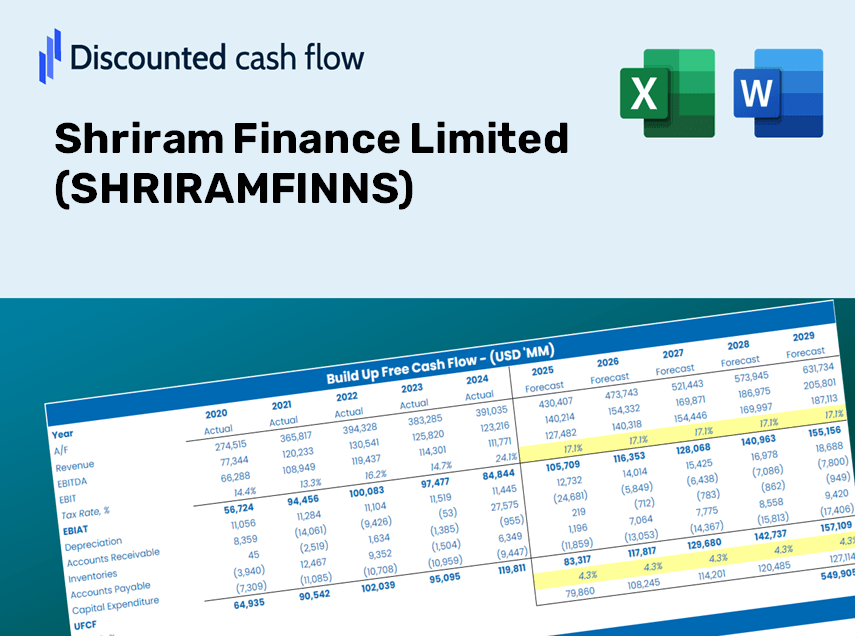
Discounted Cash Flow (DCF) - (USD MM)
| Year | AY1 2021 |
AY2 2022 |
AY3 2023 |
AY4 2024 |
AY5 2025 |
FY1 2026 |
FY2 2027 |
FY3 2028 |
FY4 2029 |
FY5 2030 |
|---|---|---|---|---|---|---|---|---|---|---|
| Revenue | 173,379.3 | 192,876.2 | 298,622.6 | 338,860.0 | 411,236.0 | 514,974.7 | 644,882.6 | 807,561.1 | 1,011,277.0 | 1,266,382.5 |
| Revenue Growth, % | 0 | 11.25 | 54.83 | 13.47 | 21.36 | 25.23 | 25.23 | 25.23 | 25.23 | 25.23 |
| EBITDA | 119,475.5 | 191,666.2 | 88,144.1 | 229,357.0 | 131,482.3 | 306,365.4 | 383,649.4 | 480,429.1 | 601,622.4 | 753,388.2 |
| EBITDA, % | 68.91 | 99.37 | 29.52 | 67.68 | 31.97 | 59.49 | 59.49 | 59.49 | 59.49 | 59.49 |
| Depreciation | 1,373.6 | 69,960.5 | 6,006.9 | 5,876.0 | 6,453.2 | 43,648.5 | 54,659.3 | 68,447.7 | 85,714.4 | 107,336.8 |
| Depreciation, % | 0.79225 | 36.27 | 2.01 | 1.73 | 1.57 | 8.48 | 8.48 | 8.48 | 8.48 | 8.48 |
| EBIT | 118,101.9 | 121,705.7 | 82,137.2 | 223,481.0 | 125,029.1 | 262,716.9 | 328,990.1 | 411,981.3 | 515,908.0 | 646,051.4 |
| EBIT, % | 68.12 | 63.1 | 27.51 | 65.95 | 30.4 | 51.02 | 51.02 | 51.02 | 51.02 | 51.02 |
| Total Cash | 114,493.9 | 112,880.5 | 104,903.6 | 111,728.0 | 197,788.8 | 247,969.1 | 310,522.0 | 388,854.5 | 486,947.2 | 609,784.9 |
| Total Cash, percent | .0 | .0 | .0 | .0 | .0 | .0 | .0 | .0 | .0 | .0 |
| Account Receivables | 588.2 | 1,980.2 | 4,466.9 | 3,921.6 | 2,538.0 | 4,775.1 | 5,979.6 | 7,488.1 | 9,377.0 | 11,742.4 |
| Account Receivables, % | 0.33926 | 1.03 | 1.5 | 1.16 | 0.61716 | 0.92724 | 0.92724 | 0.92724 | 0.92724 | 0.92724 |
| Inventories | .0 | 165,531.8 | 167,536.9 | .0 | .0 | 146,176.6 | 183,051.3 | 229,227.9 | 287,053.1 | 359,465.3 |
| Inventories, % | 0 | 85.82 | 56.1 | 0 | 0 | 28.39 | 28.39 | 28.39 | 28.39 | 28.39 |
| Accounts Payable | 1,551.5 | 1,668.9 | 3,492.1 | 2,690.2 | 3,442.9 | 4,697.2 | 5,882.1 | 7,366.0 | 9,224.1 | 11,551.0 |
| Accounts Payable, % | 0.89486 | 0.86527 | 1.17 | 0.7939 | 0.83721 | 0.91213 | 0.91213 | 0.91213 | 0.91213 | 0.91213 |
| Capital Expenditure | -258.2 | -357.5 | -1,965.9 | -2,654.9 | -2,235.9 | -2,389.3 | -2,992.0 | -3,746.7 | -4,691.9 | -5,875.5 |
| Capital Expenditure, % | -0.14892 | -0.18535 | -0.65832 | -0.78348 | -0.5437 | -0.46396 | -0.46396 | -0.46396 | -0.46396 | -0.46396 |
| Tax Rate, % | 23.66 | 23.66 | 23.66 | 23.66 | 23.66 | 23.66 | 23.66 | 23.66 | 23.66 | 23.66 |
| EBITAT | 90,029.2 | 93,308.0 | 60,110.4 | 170,002.8 | 95,444.2 | 198,870.3 | 249,037.5 | 311,859.9 | 390,529.9 | 489,045.2 |
| Depreciation | ||||||||||
| Changes in Account Receivables | ||||||||||
| Changes in Inventories | ||||||||||
| Changes in Accounts Payable | ||||||||||
| Capital Expenditure | ||||||||||
| UFCF | 92,107.9 | -3,895.4 | 61,482.8 | 340,504.2 | 101,797.8 | 92,970.2 | 263,810.6 | 330,359.7 | 413,696.4 | 518,055.8 |
| WACC, % | 7.12 | 7.14 | 6.95 | 7.11 | 7.12 | 7.09 | 7.09 | 7.09 | 7.09 | 7.09 |
| PV UFCF | ||||||||||
| SUM PV UFCF | 1,268,311.5 | |||||||||
| Long Term Growth Rate, % | 2.00 | |||||||||
| Free cash flow (T + 1) | 528,417 | |||||||||
| Terminal Value | 10,386,584 | |||||||||
| Present Terminal Value | 7,375,287 | |||||||||
| Enterprise Value | 8,643,599 | |||||||||
| Net Debt | 1,567,455 | |||||||||
| Equity Value | 7,076,144 | |||||||||
| Diluted Shares Outstanding, MM | 1,883 | |||||||||
| Equity Value Per Share | 3,758.86 |
What You Will Receive
- Accurate SHRIRAMFINNS Financials: Features both historical and projected data for precise valuation.
- Customizable Inputs: Adjust metrics such as WACC, tax rates, revenue growth, and capital expenditures.
- Real-Time Calculations: Intrinsic value and NPV are computed automatically.
- Scenario Analysis: Explore various scenarios to assess the future performance of Shriram Finance Limited.
- User-Friendly Design: Designed for industry professionals while remaining approachable for newcomers.
Key Features of Shriram Finance Limited (SHRIRAMFINNS)
- Customizable Financial Parameters: Adjust essential inputs such as loan growth, net interest margin, and operational costs.
- Instant DCF Valuation: Quickly determines intrinsic value, NPV, and various financial outcomes.
- Industry-Leading Precision: Leverages Shriram Finance’s actual financial data for accurate valuation results.
- Simplified Scenario Analysis: Easily explore different scenarios and evaluate their effects on outcomes.
- Efficiency Booster: Save time by avoiding the need to create intricate valuation models from scratch.
How It Works
- Step 1: Download the prebuilt Excel template featuring Shriram Finance Limited's (SHRIRAMFINNS) data.
- Step 2: Navigate through the pre-filled sheets to familiarize yourself with the essential metrics.
- Step 3: Modify forecasts and assumptions in the editable yellow cells (WACC, growth, margins) as needed.
- Step 4: Instantly observe the updated results, including the intrinsic value of Shriram Finance Limited (SHRIRAMFINNS).
- Step 5: Utilize the outputs to make informed investment decisions or create reports.
Why Opt for This Calculator?
- Designed for Experts: A sophisticated tool favored by analysts, CFOs, and consultants.
- Accurate Financial Data: Historical and projected financials of Shriram Finance Limited (SHRIRAMFINNS) preloaded for precision.
- Forecast Scenarios: Effortlessly simulate various forecasts and assumptions.
- Transparent Outputs: Automatically computes intrinsic value, NPV, and essential metrics.
- User-Friendly: Step-by-step guidance makes the process straightforward.
Who Can Benefit from This Product?
- Investors: Evaluate Shriram Finance Limited’s (SHRIRAMFINNS) valuation before making investment decisions.
- CFOs and Financial Analysts: Optimize valuation processes and assess financial projections.
- Startup Founders: Discover how established companies like Shriram Finance Limited are appraised.
- Consultants: Provide expert valuation reports to your clients.
- Students and Educators: Utilize real-world examples to learn and teach valuation strategies.
Contents of the Template
- Thorough DCF Model: Editable template featuring extensive valuation computations.
- Real-World Data: Shriram Finance Limited (SHRIRAMFINNS) historical and projected financials preloaded for thorough analysis.
- Adjustable Parameters: Tailor WACC, growth rates, and tax assumptions to explore various scenarios.
- Financial Statements: Complete annual and quarterly breakdowns for enhanced insights.
- Key Ratios: Integrated analysis for profitability, efficiency, and leverage metrics.
- Dashboard with Visual Outputs: Charts and tables providing clear, actionable insights.
Disclaimer
All information, articles, and product details provided on this website are for general informational and educational purposes only. We do not claim any ownership over, nor do we intend to infringe upon, any trademarks, copyrights, logos, brand names, or other intellectual property mentioned or depicted on this site. Such intellectual property remains the property of its respective owners, and any references here are made solely for identification or informational purposes, without implying any affiliation, endorsement, or partnership.
We make no representations or warranties, express or implied, regarding the accuracy, completeness, or suitability of any content or products presented. Nothing on this website should be construed as legal, tax, investment, financial, medical, or other professional advice. In addition, no part of this site—including articles or product references—constitutes a solicitation, recommendation, endorsement, advertisement, or offer to buy or sell any securities, franchises, or other financial instruments, particularly in jurisdictions where such activity would be unlawful.
All content is of a general nature and may not address the specific circumstances of any individual or entity. It is not a substitute for professional advice or services. Any actions you take based on the information provided here are strictly at your own risk. You accept full responsibility for any decisions or outcomes arising from your use of this website and agree to release us from any liability in connection with your use of, or reliance upon, the content or products found herein.