
|
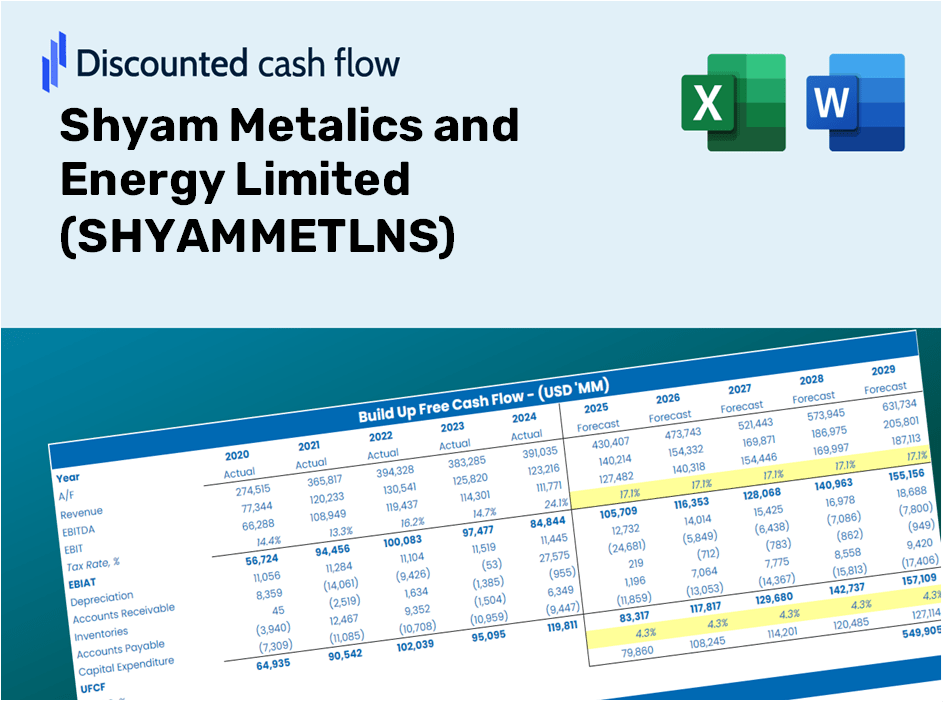
Shyam Metalics and Energy Limited (SHYAMMETL.NS) DCF Valuation |
Fully Editable: Tailor To Your Needs In Excel Or Sheets
Professional Design: Trusted, Industry-Standard Templates
Investor-Approved Valuation Models
MAC/PC Compatible, Fully Unlocked
No Expertise Is Needed; Easy To Follow
Shyam Metalics and Energy Limited (SHYAMMETL.NS) Bundle
Looking to assess the intrinsic value of Shyam Metalics and Energy Limited? Our SHYAMMETLNS DCF Calculator integrates real-world data with extensive customization features, enabling you to refine forecasts and enhance your investment strategies.
Discounted Cash Flow (DCF) - (USD MM)
| Year | AY1 2021 |
AY2 2022 |
AY3 2023 |
AY4 2024 |
AY5 2025 |
FY1 2026 |
FY2 2027 |
FY3 2028 |
FY4 2029 |
FY5 2030 |
|---|---|---|---|---|---|---|---|---|---|---|
| Revenue | 62,790.2 | 103,643.2 | 126,092.8 | 131,413.2 | 150,414.4 | 190,049.2 | 240,128.0 | 303,402.8 | 383,350.8 | 484,365.3 |
| Revenue Growth, % | 0 | 65.06 | 21.66 | 4.22 | 14.46 | 26.35 | 26.35 | 26.35 | 26.35 | 26.35 |
| EBITDA | 13,991.3 | 26,597.5 | 15,765.9 | 17,290.0 | 20,987.6 | 33,280.9 | 42,050.6 | 53,131.1 | 67,131.4 | 84,820.8 |
| EBITDA, % | 22.28 | 25.66 | 12.5 | 13.16 | 13.95 | 17.51 | 17.51 | 17.51 | 17.51 | 17.51 |
| Depreciation | 3,003.6 | 2,724.0 | 4,739.6 | 6,560.4 | 7,111.7 | 7,940.6 | 10,033.0 | 12,676.7 | 16,017.1 | 20,237.6 |
| Depreciation, % | 4.78 | 2.63 | 3.76 | 4.99 | 4.73 | 4.18 | 4.18 | 4.18 | 4.18 | 4.18 |
| EBIT | 10,987.7 | 23,873.5 | 11,026.3 | 10,729.6 | 13,875.9 | 25,340.4 | 32,017.6 | 40,454.4 | 51,114.4 | 64,583.2 |
| EBIT, % | 17.5 | 23.03 | 8.74 | 8.16 | 9.23 | 13.33 | 13.33 | 13.33 | 13.33 | 13.33 |
| Total Cash | 4,943.4 | 10,043.3 | 7,203.5 | 12,949.0 | 8,926.9 | 14,848.4 | 18,761.0 | 23,704.6 | 29,950.8 | 37,843.0 |
| Total Cash, percent | .0 | .0 | .0 | .0 | .0 | .0 | .0 | .0 | .0 | .0 |
| Account Receivables | 5,335.6 | 3,761.0 | 6,094.5 | 7,078.8 | 7,962.0 | 10,505.8 | 13,274.1 | 16,771.9 | 21,191.4 | 26,775.4 |
| Account Receivables, % | 8.5 | 3.63 | 4.83 | 5.39 | 5.29 | 5.53 | 5.53 | 5.53 | 5.53 | 5.53 |
| Inventories | 15,357.7 | 28,848.6 | 27,487.4 | 28,136.5 | 29,854.4 | 43,844.9 | 55,398.2 | 69,995.9 | 88,440.1 | 111,744.5 |
| Inventories, % | 24.46 | 27.83 | 21.8 | 21.41 | 19.85 | 23.07 | 23.07 | 23.07 | 23.07 | 23.07 |
| Accounts Payable | 3,670.4 | 11,939.4 | 15,380.0 | 23,688.8 | 29,172.4 | 25,460.3 | 32,169.2 | 40,645.9 | 51,356.3 | 64,888.9 |
| Accounts Payable, % | 5.85 | 11.52 | 12.2 | 18.03 | 19.39 | 13.4 | 13.4 | 13.4 | 13.4 | 13.4 |
| Capital Expenditure | -3,610.5 | -9,398.8 | -19,047.7 | -18,878.1 | -21,483.2 | -22,263.4 | -28,129.9 | -35,542.3 | -44,907.8 | -56,741.2 |
| Capital Expenditure, % | -5.75 | -9.07 | -15.11 | -14.37 | -14.28 | -11.71 | -11.71 | -11.71 | -11.71 | -11.71 |
| Tax Rate, % | 26.84 | 26.84 | 26.84 | 26.84 | 26.84 | 26.84 | 26.84 | 26.84 | 26.84 | 26.84 |
| EBITAT | 8,783.8 | 17,413.3 | 9,067.3 | 11,814.1 | 10,152.1 | 20,691.9 | 26,144.3 | 33,033.4 | 41,737.8 | 52,736.0 |
| Depreciation | ||||||||||
| Changes in Account Receivables | ||||||||||
| Changes in Inventories | ||||||||||
| Changes in Accounts Payable | ||||||||||
| Capital Expenditure | ||||||||||
| UFCF | -8,846.0 | 7,091.2 | -2,772.5 | 6,171.8 | -1,336.9 | -13,877.3 | 434.6 | 549.1 | 693.8 | 876.6 |
| WACC, % | 5.27 | 5.22 | 5.28 | 5.38 | 5.23 | 5.28 | 5.28 | 5.28 | 5.28 | 5.28 |
| PV UFCF | ||||||||||
| SUM PV UFCF | -11,076.4 | |||||||||
| Long Term Growth Rate, % | 2.00 | |||||||||
| Free cash flow (T + 1) | 894 | |||||||||
| Terminal Value | 27,297 | |||||||||
| Present Terminal Value | 21,109 | |||||||||
| Enterprise Value | 10,033 | |||||||||
| Net Debt | 7,212 | |||||||||
| Equity Value | 2,821 | |||||||||
| Diluted Shares Outstanding, MM | 279 | |||||||||
| Equity Value Per Share | 10.12 |
Benefits You Will Receive
- Adjustable Forecast Inputs: Effortlessly modify key assumptions (growth %, profit margins, WACC) to explore various scenarios.
- Real-World Financial Data: Shyam Metalics and Energy Limited’s (SHYAMMETLNS) financial information pre-loaded to facilitate your analysis.
- Automated DCF Calculations: The template computes Net Present Value (NPV) and intrinsic value automatically.
- Customizable and Professional Design: A refined Excel model tailored to your valuation requirements.
- Designed for Analysts and Investors: Perfect for evaluating projections, verifying strategies, and enhancing efficiency.
Key Features
- 🔍 Real-Life SHYAMMETLNS Financials: Pre-filled historical and projected data for Shyam Metalics and Energy Limited.
- ✏️ Fully Customizable Inputs: Adjust all critical parameters (yellow cells) such as WACC, growth %, and tax rates.
- 📊 Professional DCF Valuation: Built-in formulas calculate Shyam Metalics’ intrinsic value using the Discounted Cash Flow method.
- ⚡ Instant Results: Visualize Shyam Metalics’ valuation instantly after making changes.
- Scenario Analysis: Test and compare outcomes for various financial assumptions side-by-side.
How It Functions
- 1. Access the Template: Download and open the Excel file containing Shyam Metalics and Energy Limited’s (SHYAMMETLNS) preloaded data.
- 2. Customize Inputs: Adjust essential parameters such as growth expectations, WACC, and capital expenditures.
- 3. Instant Results: The DCF model automatically computes intrinsic value and NPV in real-time.
- 4. Explore Scenarios: Evaluate various forecasts to investigate different valuation possibilities.
- 5. Make Informed Decisions: Present professional valuation insights to enhance your decision-making process.
Why Opt for Shyam Metalics and Energy Limited (SHYAMMETLNS)?
- Efficiency Boost: Instantly access our tools without the hassle of building a model from the ground up.
- Enhanced Precision: Utilize dependable financial data and calculations to minimize valuation errors.
- Completely Customizable: Adjust the model to align with your unique assumptions and forecasts.
- Simple to Analyze: Intuitive charts and outputs facilitate easy interpretation of results.
- Endorsed by Industry Leaders: Crafted for professionals who prioritize accuracy and functionality.
Who Can Benefit from This Product?
- Individual Investors: Make well-informed choices regarding the purchase or sale of Shyam Metalics and Energy Limited (SHYAMMETLNS) stock.
- Financial Analysts: Enhance valuation efficiency with pre-built financial models tailored for Shyam Metalics and Energy Limited.
- Consultants: Provide timely and precise valuation insights to clients based on Shyam Metalics and Energy Limited's performance.
- Business Owners: Gain an understanding of how large enterprises like Shyam Metalics and Energy Limited are valued to inform your own business strategy.
- Finance Students: Acquire valuation skills using real data and practical scenarios related to Shyam Metalics and Energy Limited (SHYAMMETLNS).
Contents of the Template
- Preloaded SHYAMMETLNS Data: Historical and projected financial metrics, including revenue, EBIT, and capital expenditures.
- DCF and WACC Models: Professional-grade templates for calculating intrinsic value and Weighted Average Cost of Capital.
- Editable Inputs: Cells highlighted in yellow for customizing revenue growth, tax rates, and discount rates.
- Financial Statements: Comprehensive annual and quarterly financial reports for in-depth analysis.
- Key Ratios: Profitability, leverage, and efficiency ratios to assess performance.
- Dashboard and Charts: Visual representations of valuation results and underlying assumptions.
Disclaimer
All information, articles, and product details provided on this website are for general informational and educational purposes only. We do not claim any ownership over, nor do we intend to infringe upon, any trademarks, copyrights, logos, brand names, or other intellectual property mentioned or depicted on this site. Such intellectual property remains the property of its respective owners, and any references here are made solely for identification or informational purposes, without implying any affiliation, endorsement, or partnership.
We make no representations or warranties, express or implied, regarding the accuracy, completeness, or suitability of any content or products presented. Nothing on this website should be construed as legal, tax, investment, financial, medical, or other professional advice. In addition, no part of this site—including articles or product references—constitutes a solicitation, recommendation, endorsement, advertisement, or offer to buy or sell any securities, franchises, or other financial instruments, particularly in jurisdictions where such activity would be unlawful.
All content is of a general nature and may not address the specific circumstances of any individual or entity. It is not a substitute for professional advice or services. Any actions you take based on the information provided here are strictly at your own risk. You accept full responsibility for any decisions or outcomes arising from your use of this website and agree to release us from any liability in connection with your use of, or reliance upon, the content or products found herein.