
|
Signatureglobal Limited (SIGNATURE.NS) DCF Valuation |
Fully Editable: Tailor To Your Needs In Excel Or Sheets
Professional Design: Trusted, Industry-Standard Templates
Investor-Approved Valuation Models
MAC/PC Compatible, Fully Unlocked
No Expertise Is Needed; Easy To Follow
Signatureglobal (India) Limited (SIGNATURE.NS) Bundle
Save time and improve precision with our (SIGNATURENS) DCF Calculator! Equipped with real data from Signatureglobal (India) Limited and customizable assumptions, this tool enables you to forecast, analyze, and value (SIGNATURENS) as if you were a professional investor.
Benefits You Will Receive
- Edit-Friendly Forecast Inputs: Effortlessly modify key assumptions (growth %, margins, WACC) to explore various scenarios.
- Real-Time Financial Data: Signatureglobal’s financial information pre-loaded to facilitate your analysis.
- Automated DCF Calculations: The template computes the Net Present Value (NPV) and intrinsic value automatically.
- Customizable and Professional Design: A sleek Excel model that can be tailored to suit your valuation requirements.
- Designed for Analysts and Investors: Perfect for evaluating projections, confirming strategies, and enhancing efficiency.
Key Features
- Comprehensive DCF Calculator: Offers detailed unlevered and levered DCF valuation frameworks.
- WACC Tool: Pre-configured Weighted Average Cost of Capital sheet with adjustable parameters.
- Customizable Forecast Inputs: Adjust growth projections, capital expenses, and discount rates.
- Integrated Financial Ratios: Assess profitability, leverage, and efficiency ratios specific to Signatureglobal (SIGNATURENS).
- Visual Dashboard and Graphs: Graphical representations highlight essential valuation metrics for streamlined analysis.
How It Operates
- 1. Download the Template: Acquire and open the Excel file featuring Signatureglobal (India) Limited's [SIGNATURENS] preloaded data.
- 2. Modify Assumptions: Adjust crucial parameters such as growth rates, WACC, and capital expenditures.
- 3. Access Instant Results: The DCF model automatically calculates the intrinsic value and NPV.
- 4. Explore Scenarios: Evaluate various forecasts to assess different valuation results.
- 5. Present with Assurance: Deliver professional valuation insights to enhance your decision-making process.
Why Opt for the Signatureglobal (SIGNATURENS) Calculator?
- Reliable Data: Utilize accurate financial metrics from Signatureglobal for trustworthy valuation outcomes.
- Tailorable: Modify essential variables such as growth rates, WACC, and tax rates to align with your forecasts.
- Efficient: Built-in calculations save you the hassle of beginning from ground zero.
- Professional Quality: Crafted specifically for investors, analysts, and consultants.
- Easy to Use: User-friendly design and clear, step-by-step guidance make it accessible for everyone.
Who Can Benefit from Signatureglobal (India) Limited (SIGNATURENS)?
- Investors: Empower your investment choices with our industry-leading valuation tool.
- Financial Analysts: Enhance your efficiency with a customizable pre-designed DCF model.
- Consultants: Effortlessly modify the template for client deliverables or presentations.
- Finance Enthusiasts: Expand your knowledge of valuation methodologies through practical examples.
- Educators and Students: Utilize it as a valuable resource for finance courses and practical applications.
Contents of the Template
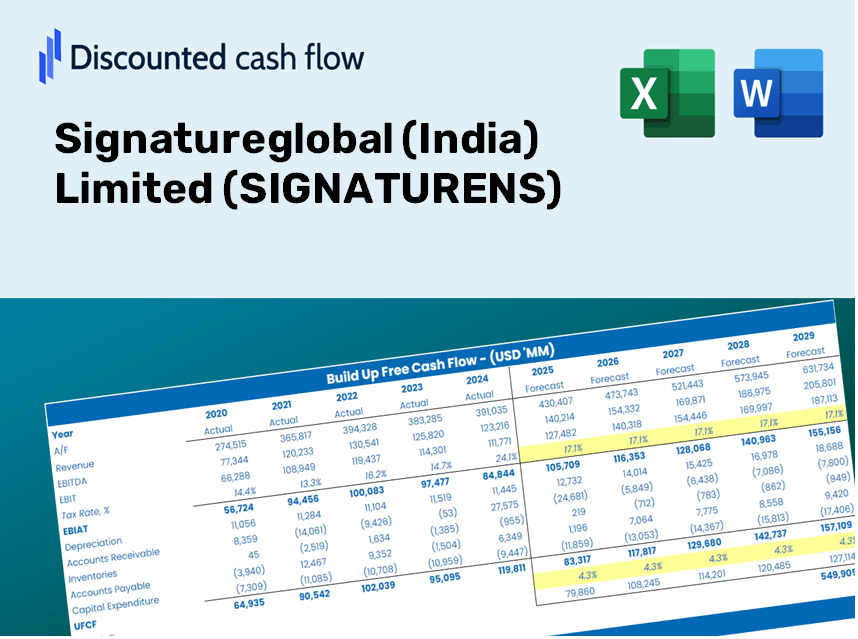
- Operating and Balance Sheet Data: Pre-filled historical data and forecasts for Signatureglobal (India) Limited (SIGNATURENS), including revenue, EBITDA, EBIT, and capital expenditures.
- WACC Calculation: A dedicated sheet for the Weighted Average Cost of Capital (WACC), featuring parameters such as Beta, risk-free rate, and share price.
- DCF Valuation (Unlevered and Levered): Customizable Discounted Cash Flow models that display intrinsic value along with comprehensive calculations.
- Financial Statements: Pre-loaded annual and quarterly financial statements to facilitate in-depth analysis.
- Key Ratios: Includes profitability, leverage, and efficiency ratios for Signatureglobal (India) Limited (SIGNATURENS).
- Dashboard and Charts: A visual overview of valuation outputs and assumptions, designed for straightforward result analysis.
Disclaimer
All information, articles, and product details provided on this website are for general informational and educational purposes only. We do not claim any ownership over, nor do we intend to infringe upon, any trademarks, copyrights, logos, brand names, or other intellectual property mentioned or depicted on this site. Such intellectual property remains the property of its respective owners, and any references here are made solely for identification or informational purposes, without implying any affiliation, endorsement, or partnership.
We make no representations or warranties, express or implied, regarding the accuracy, completeness, or suitability of any content or products presented. Nothing on this website should be construed as legal, tax, investment, financial, medical, or other professional advice. In addition, no part of this site—including articles or product references—constitutes a solicitation, recommendation, endorsement, advertisement, or offer to buy or sell any securities, franchises, or other financial instruments, particularly in jurisdictions where such activity would be unlawful.
All content is of a general nature and may not address the specific circumstances of any individual or entity. It is not a substitute for professional advice or services. Any actions you take based on the information provided here are strictly at your own risk. You accept full responsibility for any decisions or outcomes arising from your use of this website and agree to release us from any liability in connection with your use of, or reliance upon, the content or products found herein.