
|
Sprott Inc. (SII) DCF Valuation |
Fully Editable: Tailor To Your Needs In Excel Or Sheets
Professional Design: Trusted, Industry-Standard Templates
Investor-Approved Valuation Models
MAC/PC Compatible, Fully Unlocked
No Expertise Is Needed; Easy To Follow
Sprott Inc. (SII) Bundle
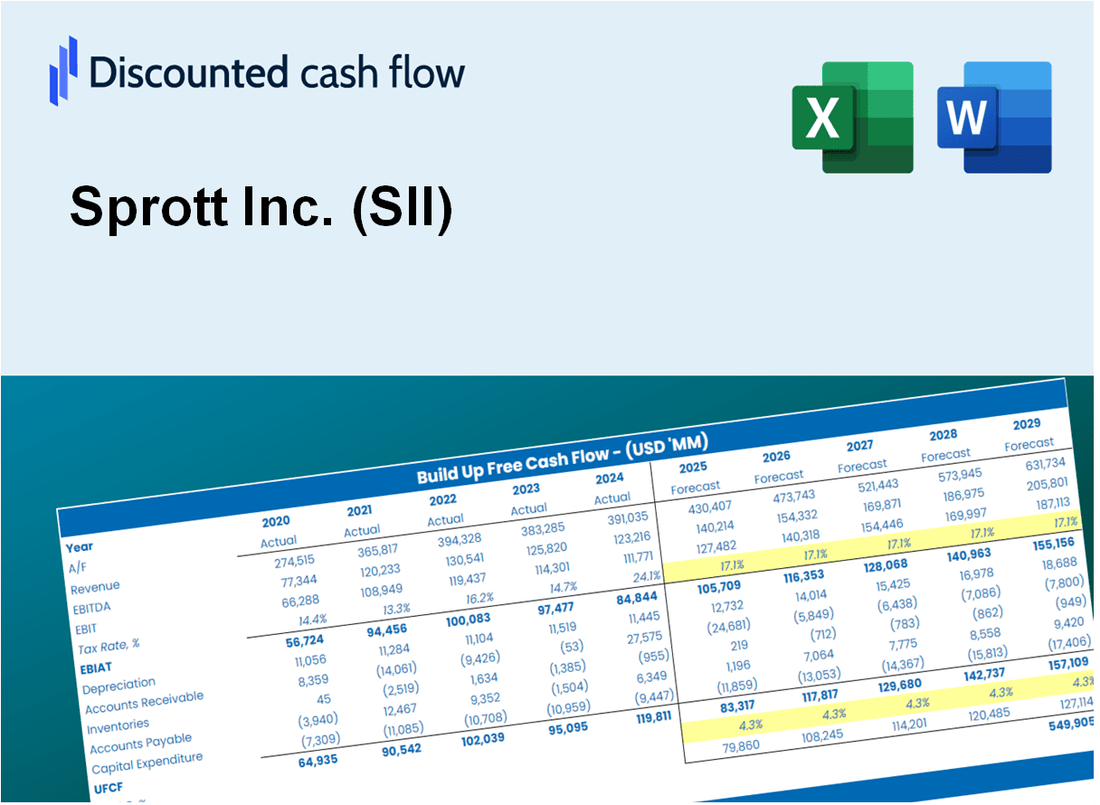
Simplify Sprott Inc. (SII) valuation with this customizable DCF Calculator! Featuring real Sprott Inc. (SII) financials and adjustable forecast inputs, you can test scenarios and uncover Sprott Inc. (SII) fair value in just minutes.
What You Will Receive
- Customizable Excel Template: A fully adjustable Excel-based DCF Calculator featuring pre-filled real SII financials.
- Actual Data: Historical performance data and forward-looking projections (highlighted in the yellow cells).
- Assumption Flexibility: Modify forecast parameters such as revenue growth, EBITDA %, and WACC.
- Instant Calculations: Quickly observe how your inputs affect Sprott Inc.'s valuation.
- Professional Resource: Designed for investors, CFOs, consultants, and financial analysts.
- Intuitive Layout: Organized for clarity and simplicity, complete with step-by-step guidance.
Key Features
- Comprehensive Asset Valuation Tool: Offers detailed unlevered and levered DCF valuation models tailored for Sprott Inc. (SII).
- Customizable WACC Calculator: Features a pre-built Weighted Average Cost of Capital sheet with adjustable inputs specific to SII.
- Flexible Forecast Assumptions: Adjust growth rates, capital expenditures, and discount rates to fit Sprott Inc.'s (SII) financial strategy.
- Integrated Financial Ratios: Evaluate profitability, leverage, and efficiency ratios pertinent to Sprott Inc. (SII).
- Interactive Dashboard and Charts: Visual representations summarize essential valuation metrics for straightforward analysis of Sprott Inc. (SII).
How It Works
- Download the Template: Gain immediate access to the Excel-based Sprott Inc. (SII) DCF Calculator.
- Input Your Assumptions: Modify the yellow-highlighted cells for growth rates, WACC, margins, and other variables.
- Instant Calculations: The model automatically recalculates Sprott Inc.'s intrinsic value.
- Test Scenarios: Experiment with various assumptions to assess potential changes in valuation.
- Analyze and Decide: Utilize the findings to inform your investment or financial strategy.
Why Choose This Calculator for Sprott Inc. (SII)?
- Accurate Data: Utilize real Sprott financials for dependable valuation outcomes.
- Customizable: Tailor essential variables like growth rates, WACC, and tax rates to align with your forecasts.
- Time-Saving: Pre-configured calculations save you the hassle of starting from the ground up.
- Professional-Grade Tool: Built for investors, analysts, and consultants focused on Sprott Inc. (SII).
- User-Friendly: Designed with an intuitive interface and guided instructions for ease of use by everyone.
Who Should Use This Product?
- Individual Investors: Make informed decisions regarding investments in Sprott Inc. (SII).
- Financial Analysts: Enhance valuation accuracy with comprehensive financial models specific to Sprott Inc. (SII).
- Consultants: Provide clients with expert valuation insights on Sprott Inc. (SII) efficiently and effectively.
- Business Owners: Gain insights into the valuation of companies like Sprott Inc. (SII) to refine your own business strategies.
- Finance Students: Explore valuation methodologies using real-time data and case studies from Sprott Inc. (SII).
What the Template Contains
- Pre-Filled DCF Model: Sprott Inc.'s (SII) financial data preloaded for immediate use.
- WACC Calculator: Detailed calculations for Weighted Average Cost of Capital.
- Financial Ratios: Evaluate Sprott Inc.'s (SII) profitability, leverage, and efficiency.
- Editable Inputs: Change assumptions such as growth, margins, and CAPEX to fit your scenarios.
- Financial Statements: Annual and quarterly reports to support detailed analysis.
- Interactive Dashboard: Easily visualize key valuation metrics and results.
Disclaimer
All information, articles, and product details provided on this website are for general informational and educational purposes only. We do not claim any ownership over, nor do we intend to infringe upon, any trademarks, copyrights, logos, brand names, or other intellectual property mentioned or depicted on this site. Such intellectual property remains the property of its respective owners, and any references here are made solely for identification or informational purposes, without implying any affiliation, endorsement, or partnership.
We make no representations or warranties, express or implied, regarding the accuracy, completeness, or suitability of any content or products presented. Nothing on this website should be construed as legal, tax, investment, financial, medical, or other professional advice. In addition, no part of this site—including articles or product references—constitutes a solicitation, recommendation, endorsement, advertisement, or offer to buy or sell any securities, franchises, or other financial instruments, particularly in jurisdictions where such activity would be unlawful.
All content is of a general nature and may not address the specific circumstances of any individual or entity. It is not a substitute for professional advice or services. Any actions you take based on the information provided here are strictly at your own risk. You accept full responsibility for any decisions or outcomes arising from your use of this website and agree to release us from any liability in connection with your use of, or reliance upon, the content or products found herein.