
|
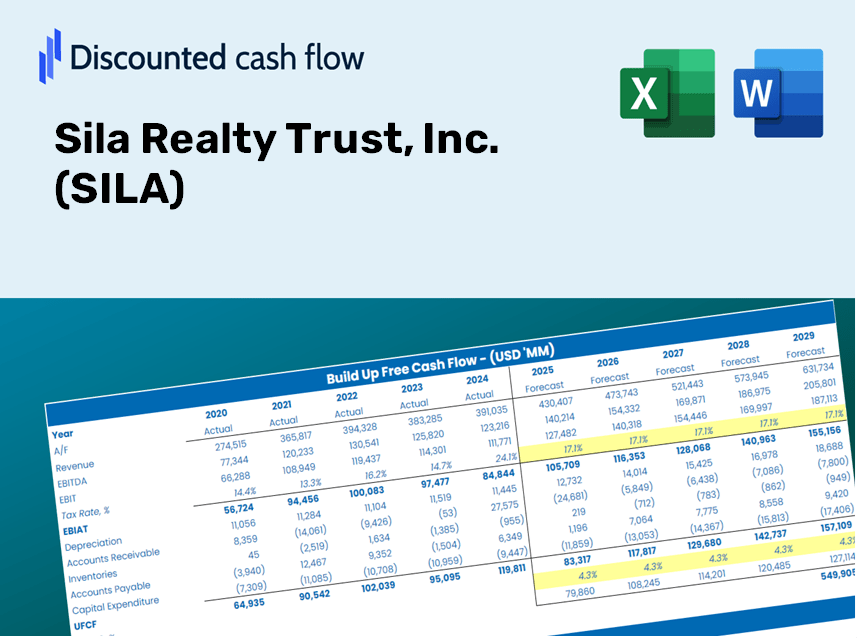
Sila Realty Trust, Inc. (SILA) DCF Valuation |
Fully Editable: Tailor To Your Needs In Excel Or Sheets
Professional Design: Trusted, Industry-Standard Templates
Investor-Approved Valuation Models
MAC/PC Compatible, Fully Unlocked
No Expertise Is Needed; Easy To Follow
Sila Realty Trust, Inc. (SILA) Bundle
Looking to determine the intrinsic value of Sila Realty Trust, Inc.? Our (SILA) DCF Calculator integrates real-world data with extensive customization options, enabling you to refine your forecasts and enhance your investment strategies.
Discounted Cash Flow (DCF) - (USD MM)
| Year | AY1 2020 |
AY2 2021 |
AY3 2022 |
AY4 2023 |
AY5 2024 |
FY1 2025 |
FY2 2026 |
FY3 2027 |
FY4 2028 |
FY5 2029 |
|---|---|---|---|---|---|---|---|---|---|---|
| Revenue | 165.8 | 172.8 | 180.0 | 189.1 | 186.9 | 192.6 | 198.5 | 204.6 | 210.9 | 217.3 |
| Revenue Growth, % | 0 | 4.26 | 4.14 | 5.04 | -1.17 | 3.07 | 3.07 | 3.07 | 3.07 | 3.07 |
| EBITDA | 117.8 | 133.7 | 140.0 | 145.0 | 139.8 | 145.5 | 149.9 | 154.5 | 159.3 | 164.2 |
| EBITDA, % | 71.06 | 77.38 | 77.76 | 76.68 | 74.82 | 75.54 | 75.54 | 75.54 | 75.54 | 75.54 |
| Depreciation | 64.8 | 70.3 | 77.2 | 74.3 | 75.9 | 78.0 | 80.4 | 82.9 | 85.4 | 88.1 |
| Depreciation, % | 39.12 | 40.65 | 42.89 | 39.29 | 40.63 | 40.52 | 40.52 | 40.52 | 40.52 | 40.52 |
| EBIT | 53.0 | 63.5 | 62.8 | 70.7 | 63.9 | 67.4 | 69.5 | 71.6 | 73.8 | 76.1 |
| EBIT, % | 31.95 | 36.73 | 34.87 | 37.38 | 34.19 | 35.02 | 35.02 | 35.02 | 35.02 | 35.02 |
| Total Cash | 53.2 | 32.4 | 12.9 | 202.0 | 39.8 | 69.1 | 71.2 | 73.4 | 75.6 | 77.9 |
| Total Cash, percent | .0 | .0 | .0 | .0 | .0 | .0 | .0 | .0 | .0 | .0 |
| Account Receivables | 76.0 | 57.6 | 64.2 | 55.6 | 61.7 | 68.3 | 70.4 | 72.5 | 74.7 | 77.0 |
| Account Receivables, % | 45.82 | 33.31 | 35.67 | 29.43 | 33.01 | 35.45 | 35.45 | 35.45 | 35.45 | 35.45 |
| Inventories | .0 | -2,154.5 | -28.0 | .0 | .0 | -44.5 | -45.9 | -47.3 | -48.7 | -50.2 |
| Inventories, % | 0 | -1246.52 | -15.55 | 0 | 0 | -23.11 | -23.11 | -23.11 | -23.11 | -23.11 |
| Accounts Payable | 10.0 | 9.4 | 5.4 | 3.9 | 6.3 | 7.7 | 7.9 | 8.1 | 8.4 | 8.7 |
| Accounts Payable, % | 6.04 | 5.44 | 2.99 | 2.07 | 3.37 | 3.98 | 3.98 | 3.98 | 3.98 | 3.98 |
| Capital Expenditure | -28.8 | -25.3 | -8.4 | -3.2 | -3.0 | -15.4 | -15.9 | -16.4 | -16.9 | -17.4 |
| Capital Expenditure, % | -17.37 | -14.63 | -4.69 | -1.68 | -1.6 | -7.99 | -7.99 | -7.99 | -7.99 | -7.99 |
| Tax Rate, % | 0 | 0 | 0 | 0 | 0 | 0 | 0 | 0 | 0 | 0 |
| EBITAT | 217.9 | 21,020.1 | 62.8 | 70.7 | 63.9 | 67.4 | 69.5 | 71.6 | 73.8 | 76.1 |
| Depreciation | ||||||||||
| Changes in Account Receivables | ||||||||||
| Changes in Inventories | ||||||||||
| Changes in Accounts Payable | ||||||||||
| Capital Expenditure | ||||||||||
| UFCF | 188.1 | 23,237.3 | -2,005.6 | 120.9 | 133.2 | 169.4 | 133.6 | 137.7 | 141.9 | 146.3 |
| WACC, % | 4.31 | 4.31 | 4.31 | 4.31 | 4.31 | 4.31 | 4.31 | 4.31 | 4.31 | 4.31 |
| PV UFCF | ||||||||||
| SUM PV UFCF | 644.8 | |||||||||
| Long Term Growth Rate, % | 2.00 | |||||||||
| Free cash flow (T + 1) | 149 | |||||||||
| Terminal Value | 6,462 | |||||||||
| Present Terminal Value | 5,233 | |||||||||
| Enterprise Value | 5,878 | |||||||||
| Net Debt | 524 | |||||||||
| Equity Value | 5,355 | |||||||||
| Diluted Shares Outstanding, MM | 57 | |||||||||
| Equity Value Per Share | 94.46 |
What You Will Receive
- Authentic Sila Realty Data: Preloaded financials – encompassing everything from revenue to EBIT – grounded in actual and projected figures.
- Comprehensive Customization: Modify all essential parameters (yellow cells) such as WACC, growth %, and tax rates.
- Real-Time Valuation Adjustments: Automatic recalculations to evaluate the effects of changes on the fair value of Sila Realty Trust, Inc. (SILA).
- Flexible Excel Template: Designed for quick modifications, scenario exploration, and in-depth projections.
- Efficient and Reliable: Avoid the hassle of building models from the ground up while ensuring accuracy and adaptability.
Key Features
- 🔍 Real-Life SILA Financials: Pre-filled historical and projected data for Sila Realty Trust, Inc. (SILA).
- ✏️ Fully Customizable Inputs: Adjust all essential parameters (yellow cells) such as WACC, growth %, and tax rates.
- 📊 Professional DCF Valuation: Integrated formulas calculate Sila Realty Trust’s intrinsic value using the Discounted Cash Flow method.
- ⚡ Instant Results: Visualize the valuation of Sila Realty Trust immediately after making adjustments.
- Scenario Analysis: Evaluate and compare various financial assumptions side-by-side.
How It Functions
- Step 1: Download the Excel spreadsheet.
- Step 2: Examine the pre-filled data for Sila Realty Trust, Inc. (SILA) (historical and projected).
- Step 3: Modify key assumptions (highlighted in yellow) based on your evaluation.
- Step 4: Observe the automatic recalculations for the intrinsic value of Sila Realty Trust, Inc. (SILA).
- Step 5: Utilize the results for your investment strategies or reporting needs.
Why Select the Sila Realty Trust Calculator?
- Designed for Industry Experts: A sophisticated tool utilized by real estate analysts, portfolio managers, and financial consultants.
- Accurate Market Data: Sila Realty Trust’s historical and projected financials preloaded for precision.
- Flexible Scenario Analysis: Easily simulate various investment forecasts and assumptions.
- Comprehensive Outputs: Instantly calculates intrinsic value, NPV, and other essential metrics.
- User-Friendly Interface: Step-by-step guidance simplifies the calculation process.
Who Should Consider Sila Realty Trust, Inc. (SILA)?
- Real Estate Investors: Assess the valuation of Sila Realty Trust (SILA) before making investment decisions.
- CFOs and Financial Analysts: Enhance valuation workflows and evaluate financial forecasts.
- Real Estate Entrepreneurs: Discover valuation methodologies used by established companies like Sila Realty Trust (SILA).
- Consultants: Create detailed valuation reports for your clients based on Sila Realty Trust (SILA).
- Academics and Students: Utilize real estate data to practice and teach valuation strategies.
Contents of the Template
- Pre-Filled DCF Model: Sila Realty Trust, Inc.'s (SILA) financial data preloaded for immediate use.
- WACC Calculator: Comprehensive calculations for the Weighted Average Cost of Capital.
- Financial Ratios: Assess Sila Realty Trust's (SILA) profitability, leverage, and operational efficiency.
- Editable Inputs: Modify assumptions such as growth rates, profit margins, and CAPEX to suit your analysis.
- Financial Statements: Annual and quarterly reports to facilitate thorough evaluation.
- Interactive Dashboard: Seamlessly visualize key valuation metrics and outcomes.
Disclaimer
All information, articles, and product details provided on this website are for general informational and educational purposes only. We do not claim any ownership over, nor do we intend to infringe upon, any trademarks, copyrights, logos, brand names, or other intellectual property mentioned or depicted on this site. Such intellectual property remains the property of its respective owners, and any references here are made solely for identification or informational purposes, without implying any affiliation, endorsement, or partnership.
We make no representations or warranties, express or implied, regarding the accuracy, completeness, or suitability of any content or products presented. Nothing on this website should be construed as legal, tax, investment, financial, medical, or other professional advice. In addition, no part of this site—including articles or product references—constitutes a solicitation, recommendation, endorsement, advertisement, or offer to buy or sell any securities, franchises, or other financial instruments, particularly in jurisdictions where such activity would be unlawful.
All content is of a general nature and may not address the specific circumstances of any individual or entity. It is not a substitute for professional advice or services. Any actions you take based on the information provided here are strictly at your own risk. You accept full responsibility for any decisions or outcomes arising from your use of this website and agree to release us from any liability in connection with your use of, or reliance upon, the content or products found herein.