
|
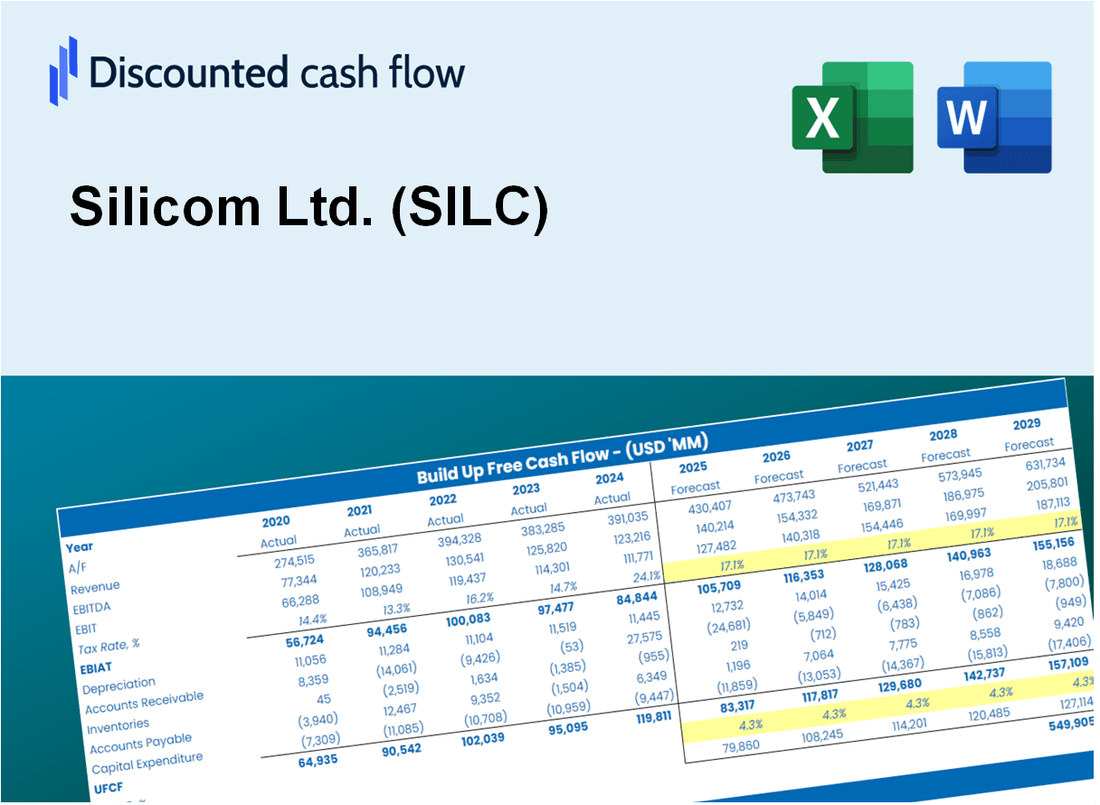
Silicom Ltd. (SILC) DCF Valuation |
Fully Editable: Tailor To Your Needs In Excel Or Sheets
Professional Design: Trusted, Industry-Standard Templates
Investor-Approved Valuation Models
MAC/PC Compatible, Fully Unlocked
No Expertise Is Needed; Easy To Follow
Silicom Ltd. (SILC) Bundle
If you're an investor or analyst, this Silicom Ltd. (SILC) DCF Calculator is your go-to resource for accurate valuation. Equipped with real data from Silicom Ltd., you can adjust forecasts and observe the effects in real time.
Discounted Cash Flow (DCF) - (USD MM)
| Year | AY1 2020 |
AY2 2021 |
AY3 2022 |
AY4 2023 |
AY5 2024 |
FY1 2025 |
FY2 2026 |
FY3 2027 |
FY4 2028 |
FY5 2029 |
|---|---|---|---|---|---|---|---|---|---|---|
| Revenue | 107.4 | 128.5 | 150.6 | 124.1 | 58.1 | 53.2 | 48.7 | 44.5 | 40.8 | 37.3 |
| Revenue Growth, % | 0 | 19.61 | 17.22 | -17.57 | -53.18 | -8.48 | -8.48 | -8.48 | -8.48 | -8.48 |
| EBITDA | 8.6 | 15.5 | 22.3 | -.6 | -11.1 | 1.6 | 1.5 | 1.4 | 1.3 | 1.1 |
| EBITDA, % | 8.04 | 12.06 | 14.84 | -0.49625 | -19.05 | 3.08 | 3.08 | 3.08 | 3.08 | 3.08 |
| Depreciation | 2.4 | 2.4 | 2.4 | 2.5 | 2.2 | 1.2 | 1.1 | 1.0 | .9 | .9 |
| Depreciation, % | 2.22 | 1.9 | 1.6 | 2.01 | 3.8 | 2.31 | 2.31 | 2.31 | 2.31 | 2.31 |
| EBIT | 6.2 | 13.1 | 19.9 | -3.1 | -13.3 | .4 | .4 | .3 | .3 | .3 |
| EBIT, % | 5.82 | 10.16 | 13.23 | -2.51 | -22.85 | 0.7717 | 0.7717 | 0.7717 | 0.7717 | 0.7717 |
| Total Cash | 60.8 | 37.6 | 34.8 | 54.9 | 72.1 | 26.9 | 24.6 | 22.6 | 20.6 | 18.9 |
| Total Cash, percent | .0 | .0 | .0 | .0 | .0 | .0 | .0 | .0 | .0 | .0 |
| Account Receivables | 26.7 | 34.7 | 29.5 | 27.7 | 11.7 | 12.1 | 11.1 | 10.2 | 9.3 | 8.5 |
| Account Receivables, % | 24.85 | 27.02 | 19.6 | 22.34 | 20.22 | 22.81 | 22.81 | 22.81 | 22.81 | 22.81 |
| Inventories | 47.7 | 75.8 | 88.0 | 51.6 | 41.1 | 29.1 | 26.7 | 24.4 | 22.3 | 20.5 |
| Inventories, % | 44.37 | 58.97 | 58.43 | 41.6 | 70.65 | 54.81 | 54.81 | 54.81 | 54.81 | 54.81 |
| Accounts Payable | 14.6 | 29.9 | 15.9 | 4.1 | 6.5 | 6.6 | 6.0 | 5.5 | 5.1 | 4.6 |
| Accounts Payable, % | 13.6 | 23.29 | 10.57 | 3.33 | 11.15 | 12.39 | 12.39 | 12.39 | 12.39 | 12.39 |
| Capital Expenditure | -3.2 | -6.2 | -4.7 | -2.2 | -.9 | -1.5 | -1.4 | -1.3 | -1.2 | -1.1 |
| Capital Expenditure, % | -2.96 | -4.79 | -3.12 | -1.78 | -1.6 | -2.85 | -2.85 | -2.85 | -2.85 | -2.85 |
| Tax Rate, % | -21.13 | -21.13 | -21.13 | -21.13 | -21.13 | -21.13 | -21.13 | -21.13 | -21.13 | -21.13 |
| EBITAT | 4.9 | 10.7 | 16.3 | -3.0 | -16.1 | .4 | .3 | .3 | .3 | .3 |
| Depreciation | ||||||||||
| Changes in Account Receivables | ||||||||||
| Changes in Inventories | ||||||||||
| Changes in Accounts Payable | ||||||||||
| Capital Expenditure | ||||||||||
| UFCF | -55.6 | -13.9 | -7.0 | 23.6 | 14.1 | 11.7 | 3.0 | 2.8 | 2.5 | 2.3 |
| WACC, % | 7.78 | 7.78 | 7.78 | 7.81 | 7.82 | 7.8 | 7.8 | 7.8 | 7.8 | 7.8 |
| PV UFCF | ||||||||||
| SUM PV UFCF | 19.1 | |||||||||
| Long Term Growth Rate, % | 3.50 | |||||||||
| Free cash flow (T + 1) | 2 | |||||||||
| Terminal Value | 56 | |||||||||
| Present Terminal Value | 38 | |||||||||
| Enterprise Value | 57 | |||||||||
| Net Debt | -45 | |||||||||
| Equity Value | 102 | |||||||||
| Diluted Shares Outstanding, MM | 6 | |||||||||
| Equity Value Per Share | 16.95 |
What You Will Get
- Real Silicom Data: Preloaded financials – from revenue to EBIT – based on actual and projected figures.
- Full Customization: Adjust all critical parameters (yellow cells) like WACC, growth %, and tax rates.
- Instant Valuation Updates: Automatic recalculations to analyze the impact of changes on Silicom Ltd.’s (SILC) fair value.
- Versatile Excel Template: Tailored for quick edits, scenario testing, and detailed projections.
- Time-Saving and Accurate: Skip building models from scratch while maintaining precision and flexibility.
Key Features
- Real-Time SILC Data: Pre-filled with Silicom Ltd.'s historical performance metrics and future projections.
- Fully Customizable Inputs: Modify revenue growth, profit margins, discount rates, tax percentages, and capital investments.
- Dynamic Valuation Model: Instant updates to Net Present Value (NPV) and intrinsic value based on your customized inputs.
- Scenario Testing: Develop various forecasting scenarios to evaluate different valuation results.
- User-Friendly Interface: Intuitive, organized, and designed for both professionals and newcomers.
How It Works
- Step 1: Download the Excel file.
- Step 2: Review pre-entered Silicom Ltd. (SILC) data (historical and projected).
- Step 3: Adjust key assumptions (yellow cells) based on your analysis.
- Step 4: View automatic recalculations for Silicom Ltd.'s intrinsic value.
- Step 5: Use the outputs for investment decisions or reporting.
Why Choose Silicom Ltd. (SILC) Calculator?
- Accuracy: Utilizes real Silicom financial data to ensure precise calculations.
- Flexibility: Allows users to easily adjust and test various input parameters.
- Time-Saving: Eliminate the need to create a financial model from the ground up.
- Professional-Grade: Crafted with the expertise and precision expected at the CFO level.
- User-Friendly: Designed for simplicity, making it accessible for users with varying financial backgrounds.
Who Should Use This Product?
- Individual Investors: Make informed decisions about buying or selling Silicom Ltd. (SILC) stock.
- Financial Analysts: Streamline valuation processes with ready-to-use financial models tailored for Silicom Ltd. (SILC).
- Consultants: Deliver professional valuation insights on Silicom Ltd. (SILC) to clients quickly and accurately.
- Business Owners: Understand how companies like Silicom Ltd. (SILC) are valued to guide your own business strategy.
- Finance Students: Learn valuation techniques using real-world data and scenarios related to Silicom Ltd. (SILC).
What the Template Contains
- Historical Data: Includes Silicom Ltd.'s (SILC) past financials and baseline forecasts.
- DCF and Levered DCF Models: Detailed templates to calculate Silicom Ltd.'s (SILC) intrinsic value.
- WACC Sheet: Pre-built calculations for Weighted Average Cost of Capital.
- Editable Inputs: Modify key drivers like growth rates, EBITDA %, and CAPEX assumptions.
- Quarterly and Annual Statements: A complete breakdown of Silicom Ltd.'s (SILC) financials.
- Interactive Dashboard: Visualize valuation results and projections dynamically.
Disclaimer
All information, articles, and product details provided on this website are for general informational and educational purposes only. We do not claim any ownership over, nor do we intend to infringe upon, any trademarks, copyrights, logos, brand names, or other intellectual property mentioned or depicted on this site. Such intellectual property remains the property of its respective owners, and any references here are made solely for identification or informational purposes, without implying any affiliation, endorsement, or partnership.
We make no representations or warranties, express or implied, regarding the accuracy, completeness, or suitability of any content or products presented. Nothing on this website should be construed as legal, tax, investment, financial, medical, or other professional advice. In addition, no part of this site—including articles or product references—constitutes a solicitation, recommendation, endorsement, advertisement, or offer to buy or sell any securities, franchises, or other financial instruments, particularly in jurisdictions where such activity would be unlawful.
All content is of a general nature and may not address the specific circumstances of any individual or entity. It is not a substitute for professional advice or services. Any actions you take based on the information provided here are strictly at your own risk. You accept full responsibility for any decisions or outcomes arising from your use of this website and agree to release us from any liability in connection with your use of, or reliance upon, the content or products found herein.