
|
SL Green Realty Corp. (SLG) DCF Valuation |
Fully Editable: Tailor To Your Needs In Excel Or Sheets
Professional Design: Trusted, Industry-Standard Templates
Investor-Approved Valuation Models
MAC/PC Compatible, Fully Unlocked
No Expertise Is Needed; Easy To Follow
SL Green Realty Corp. (SLG) Bundle
Engineered for accuracy, our SL Green Realty Corp. (SLG) DCF Calculator empowers you to evaluate SLG's valuation using real-world financial data, offering complete flexibility to modify all key parameters for enhanced projections.
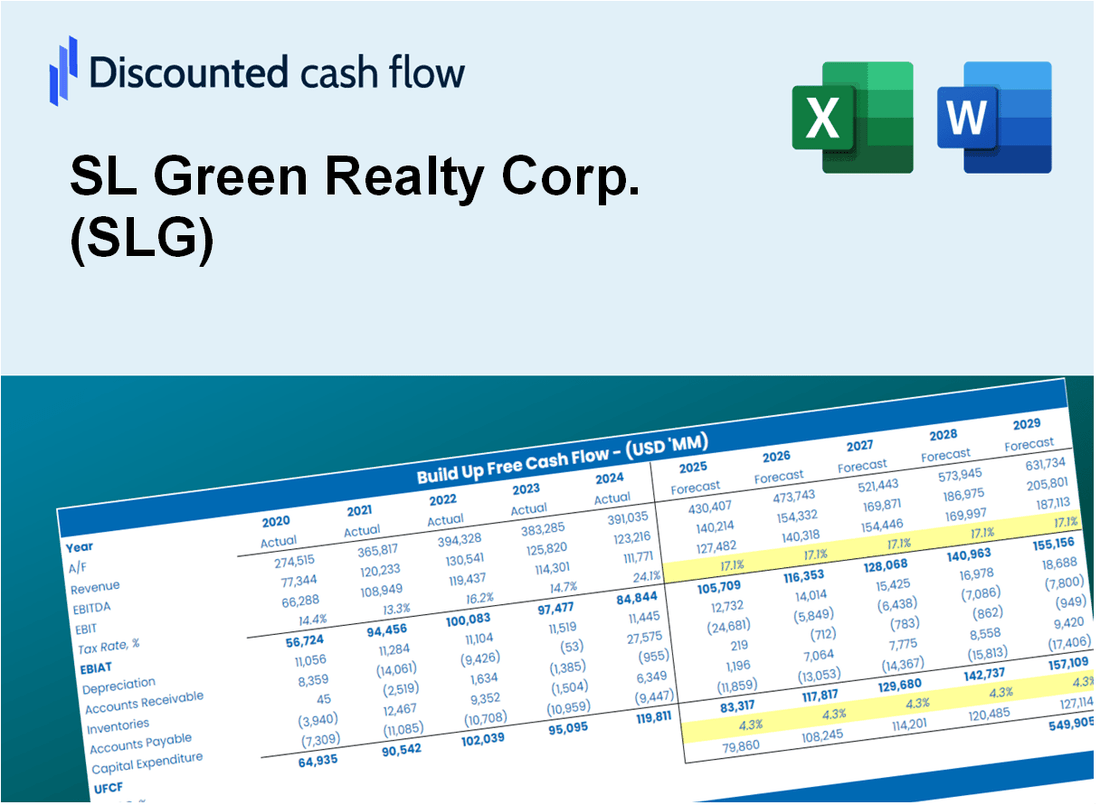
Discounted Cash Flow (DCF) - (USD MM)
| Year | AY1 2020 |
AY2 2021 |
AY3 2022 |
AY4 2023 |
AY5 2024 |
FY1 2025 |
FY2 2026 |
FY3 2027 |
FY4 2028 |
FY5 2029 |
|---|---|---|---|---|---|---|---|---|---|---|
| Revenue | 1,027.5 | 805.9 | 861.5 | 837.2 | 706.6 | 648.1 | 594.5 | 545.3 | 500.2 | 458.8 |
| Revenue Growth, % | 0 | -21.57 | 6.9 | -2.82 | -15.6 | -8.27 | -8.27 | -8.27 | -8.27 | -8.27 |
| EBITDA | 511.9 | 340.1 | 330.9 | 240.3 | 169.3 | 237.3 | 217.7 | 199.7 | 183.2 | 168.0 |
| EBITDA, % | 49.81 | 42.21 | 38.41 | 28.71 | 23.96 | 36.62 | 36.62 | 36.62 | 36.62 | 36.62 |
| Depreciation | 313.7 | 212.8 | 210.5 | 233.6 | 210.0 | 180.2 | 165.3 | 151.6 | 139.0 | 127.5 |
| Depreciation, % | 30.53 | 26.41 | 24.43 | 27.9 | 29.72 | 27.8 | 27.8 | 27.8 | 27.8 | 27.8 |
| EBIT | 198.2 | 127.3 | 120.4 | 6.7 | -40.7 | 57.2 | 52.4 | 48.1 | 44.1 | 40.5 |
| EBIT, % | 19.29 | 15.8 | 13.98 | 0.80447 | -5.76 | 8.82 | 8.82 | 8.82 | 8.82 | 8.82 |
| Total Cash | 294.6 | 286.2 | 214.5 | 231.4 | 207.1 | 189.3 | 173.6 | 159.3 | 146.1 | 134.0 |
| Total Cash, percent | .0 | .0 | .0 | .0 | .0 | .0 | .0 | .0 | .0 | .0 |
| Account Receivables | 382.0 | 325.3 | 319.7 | 310.1 | 1,046.4 | 326.3 | 299.3 | 274.5 | 251.8 | 231.0 |
| Account Receivables, % | 37.17 | 40.37 | 37.11 | 37.04 | 148.1 | 50.34 | 50.34 | 50.34 | 50.34 | 50.34 |
| Inventories | .0 | .0 | .0 | .0 | .0 | .0 | .0 | .0 | .0 | .0 |
| Inventories, % | 0 | 0 | 0 | 0 | 0 | 0 | 0 | 0 | 0 | 0 |
| Accounts Payable | 151.3 | 157.6 | 154.9 | 153.2 | 122.7 | 114.0 | 104.5 | 95.9 | 87.9 | 80.7 |
| Accounts Payable, % | 14.73 | 19.55 | 17.98 | 18.29 | 17.36 | 17.58 | 17.58 | 17.58 | 17.58 | 17.58 |
| Capital Expenditure | .0 | .0 | -300.8 | .0 | -211.9 | -84.1 | -77.2 | -70.8 | -64.9 | -59.6 |
| Capital Expenditure, % | 0 | 0 | -34.91 | 0 | -29.99 | -12.98 | -12.98 | -12.98 | -12.98 | -12.98 |
| Tax Rate, % | -1.43 | -1.43 | -1.43 | -1.43 | -1.43 | -1.43 | -1.43 | -1.43 | -1.43 | -1.43 |
| EBITAT | 181.5 | 121.1 | 113.1 | 6.3 | -41.3 | 54.1 | 49.7 | 45.5 | 41.8 | 38.3 |
| Depreciation | ||||||||||
| Changes in Account Receivables | ||||||||||
| Changes in Inventories | ||||||||||
| Changes in Accounts Payable | ||||||||||
| Capital Expenditure | ||||||||||
| UFCF | 264.5 | 396.8 | 25.6 | 247.8 | -810.0 | 861.6 | 155.3 | 142.5 | 130.7 | 119.9 |
| WACC, % | 6.61 | 6.69 | 6.66 | 6.64 | 6.8 | 6.68 | 6.68 | 6.68 | 6.68 | 6.68 |
| PV UFCF | ||||||||||
| SUM PV UFCF | 1,249.1 | |||||||||
| Long Term Growth Rate, % | 3.70 | |||||||||
| Free cash flow (T + 1) | 124 | |||||||||
| Terminal Value | 4,171 | |||||||||
| Present Terminal Value | 3,018 | |||||||||
| Enterprise Value | 4,268 | |||||||||
| Net Debt | 4,340 | |||||||||
| Equity Value | -73 | |||||||||
| Diluted Shares Outstanding, MM | 66 | |||||||||
| Equity Value Per Share | -1.11 |
What You Will Get
- Pre-Filled Financial Model: SL Green Realty Corp.'s actual data allows for accurate DCF valuation.
- Full Forecast Control: Modify revenue growth, operating margins, cap rates, and other essential drivers.
- Instant Calculations: Real-time updates ensure you see the impact of your adjustments immediately.
- Investor-Ready Template: A polished Excel file crafted for high-quality real estate valuation.
- Customizable and Reusable: Designed for adaptability, making it suitable for multiple detailed forecasts.
Key Features
- Comprehensive Data: SL Green Realty Corp.’s historical financial statements and pre-filled forecasts.
- Customizable Inputs: Modify WACC, tax rates, revenue growth, and EBITDA margins as needed.
- Real-Time Calculations: Observe SL Green Realty Corp.’s intrinsic value update instantly.
- Visual Performance Metrics: Dashboard charts illustrate valuation outcomes and essential metrics.
- Designed for Precision: A reliable tool for analysts, investors, and finance professionals.
How It Works
- 1. Access the Template: Download and open the Excel file containing SL Green Realty Corp. (SLG)'s preloaded data.
- 2. Modify Assumptions: Adjust key inputs such as growth rates, WACC, and capital expenditures.
- 3. Analyze Results Instantly: The DCF model automatically computes intrinsic value and NPV.
- 4. Evaluate Scenarios: Compare various forecasts to assess different valuation outcomes.
- 5. Present with Confidence: Share professional valuation insights to bolster your decision-making.
Why Choose This Calculator for SL Green Realty Corp. (SLG)?
- Accuracy: Utilizes real SL Green financials to ensure precise data.
- Flexibility: Tailored for users to easily adjust and experiment with inputs.
- Time-Saving: Eliminate the need to create a DCF model from the ground up.
- Professional-Grade: Crafted with the precision and usability expected by CFOs.
- User-Friendly: Intuitive design makes it accessible for those without extensive financial modeling expertise.
Who Should Use This Product?
- Real Estate Investors: Evaluate SL Green Realty Corp.'s (SLG) performance before making investment decisions.
- CFOs and Financial Analysts: Optimize valuation methods and assess financial forecasts for SLG.
- Commercial Property Developers: Understand how leading firms like SL Green are appraised in the market.
- Consultants: Provide clients with comprehensive valuation assessments for real estate portfolios.
- Students and Educators: Utilize current market data to teach and learn about real estate valuation principles.
What the Template Contains
- Historical Data: Includes SL Green Realty Corp.’s (SLG) past financials and baseline forecasts.
- DCF and Levered DCF Models: Detailed templates to calculate SL Green Realty Corp.’s (SLG) intrinsic value.
- WACC Sheet: Pre-built calculations for Weighted Average Cost of Capital.
- Editable Inputs: Modify key drivers like growth rates, EBITDA %, and CAPEX assumptions.
- Quarterly and Annual Statements: A complete breakdown of SL Green Realty Corp.’s (SLG) financials.
- Interactive Dashboard: Visualize valuation results and projections dynamically.
Disclaimer
All information, articles, and product details provided on this website are for general informational and educational purposes only. We do not claim any ownership over, nor do we intend to infringe upon, any trademarks, copyrights, logos, brand names, or other intellectual property mentioned or depicted on this site. Such intellectual property remains the property of its respective owners, and any references here are made solely for identification or informational purposes, without implying any affiliation, endorsement, or partnership.
We make no representations or warranties, express or implied, regarding the accuracy, completeness, or suitability of any content or products presented. Nothing on this website should be construed as legal, tax, investment, financial, medical, or other professional advice. In addition, no part of this site—including articles or product references—constitutes a solicitation, recommendation, endorsement, advertisement, or offer to buy or sell any securities, franchises, or other financial instruments, particularly in jurisdictions where such activity would be unlawful.
All content is of a general nature and may not address the specific circumstances of any individual or entity. It is not a substitute for professional advice or services. Any actions you take based on the information provided here are strictly at your own risk. You accept full responsibility for any decisions or outcomes arising from your use of this website and agree to release us from any liability in connection with your use of, or reliance upon, the content or products found herein.