
|
Standard Motor Products, Inc. (SMP) DCF Valuation |
Fully Editable: Tailor To Your Needs In Excel Or Sheets
Professional Design: Trusted, Industry-Standard Templates
Investor-Approved Valuation Models
MAC/PC Compatible, Fully Unlocked
No Expertise Is Needed; Easy To Follow
Standard Motor Products, Inc. (SMP) Bundle
Enhance your investment choices with the (SMP) DCF Calculator! Explore genuine Standard Motor Products financials, adjust growth predictions and expenses, and instantly observe how modifications influence the intrinsic value of (SMP).
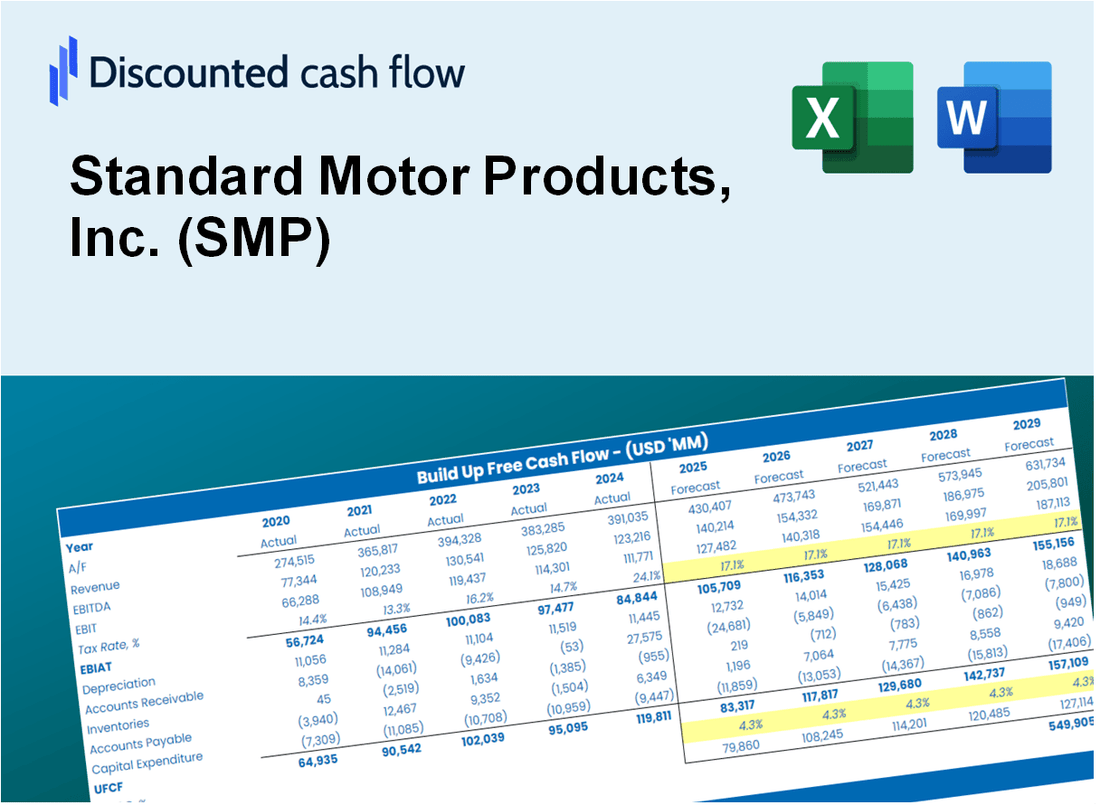
Discounted Cash Flow (DCF) - (USD MM)
| Year | AY1 2020 |
AY2 2021 |
AY3 2022 |
AY4 2023 |
AY5 2024 |
FY1 2025 |
FY2 2026 |
FY3 2027 |
FY4 2028 |
FY5 2029 |
|---|---|---|---|---|---|---|---|---|---|---|
| Revenue | 1,128.6 | 1,298.8 | 1,371.8 | 1,358.3 | 1,463.8 | 1,564.4 | 1,672.0 | 1,786.9 | 1,909.7 | 2,040.9 |
| Revenue Growth, % | 0 | 15.08 | 5.62 | -0.98723 | 7.77 | 6.87 | 6.87 | 6.87 | 6.87 | 6.87 |
| EBITDA | 136.0 | 159.7 | 137.2 | 121.7 | 116.4 | 160.4 | 171.4 | 183.2 | 195.8 | 209.2 |
| EBITDA, % | 12.05 | 12.3 | 10 | 8.96 | 7.95 | 10.25 | 10.25 | 10.25 | 10.25 | 10.25 |
| Depreciation | 26.3 | 27.2 | 28.3 | 29.0 | 31.4 | 33.7 | 36.0 | 38.5 | 41.2 | 44.0 |
| Depreciation, % | 2.33 | 2.1 | 2.06 | 2.14 | 2.15 | 2.16 | 2.16 | 2.16 | 2.16 | 2.16 |
| EBIT | 109.7 | 132.5 | 108.9 | 92.6 | 85.0 | 126.7 | 135.4 | 144.7 | 154.6 | 165.3 |
| EBIT, % | 9.72 | 10.2 | 7.94 | 6.82 | 5.81 | 8.1 | 8.1 | 8.1 | 8.1 | 8.1 |
| Total Cash | 19.5 | 21.8 | 21.2 | 32.5 | 44.4 | 32.5 | 34.7 | 37.1 | 39.6 | 42.3 |
| Total Cash, percent | .0 | .0 | .0 | .0 | .0 | .0 | .0 | .0 | .0 | .0 |
| Account Receivables | 198.0 | 180.6 | 167.6 | 160.3 | 210.7 | 218.6 | 233.6 | 249.7 | 266.9 | 285.2 |
| Account Receivables, % | 17.55 | 13.91 | 12.22 | 11.8 | 14.39 | 13.97 | 13.97 | 13.97 | 13.97 | 13.97 |
| Inventories | 365.1 | 491.0 | 548.4 | 525.3 | 641.1 | 602.6 | 644.1 | 688.3 | 735.6 | 786.2 |
| Inventories, % | 32.35 | 37.81 | 39.98 | 38.68 | 43.79 | 38.52 | 38.52 | 38.52 | 38.52 | 38.52 |
| Accounts Payable | 100.0 | 137.2 | 89.2 | 107.5 | 148.0 | 137.5 | 147.0 | 157.1 | 167.9 | 179.4 |
| Accounts Payable, % | 8.86 | 10.56 | 6.51 | 7.91 | 10.11 | 8.79 | 8.79 | 8.79 | 8.79 | 8.79 |
| Capital Expenditure | -17.8 | -25.9 | -26.0 | -28.6 | -44.0 | -33.1 | -35.4 | -37.8 | -40.4 | -43.2 |
| Capital Expenditure, % | -1.58 | -1.99 | -1.89 | -2.11 | -3.01 | -2.12 | -2.12 | -2.12 | -2.12 | -2.12 |
| Tax Rate, % | 27.52 | 27.52 | 27.52 | 27.52 | 27.52 | 27.52 | 27.52 | 27.52 | 27.52 | 27.52 |
| EBITAT | 58.6 | 92.3 | 80.9 | 71.6 | 61.6 | 88.0 | 94.0 | 100.5 | 107.4 | 114.7 |
| Depreciation | ||||||||||
| Changes in Account Receivables | ||||||||||
| Changes in Inventories | ||||||||||
| Changes in Accounts Payable | ||||||||||
| Capital Expenditure | ||||||||||
| UFCF | -396.0 | 22.4 | -9.1 | 120.6 | -76.7 | 108.6 | 47.7 | 50.9 | 54.4 | 58.2 |
| WACC, % | 4.86 | 5.13 | 5.2 | 5.25 | 5.17 | 5.12 | 5.12 | 5.12 | 5.12 | 5.12 |
| PV UFCF | ||||||||||
| SUM PV UFCF | 280.2 | |||||||||
| Long Term Growth Rate, % | 2.00 | |||||||||
| Free cash flow (T + 1) | 59 | |||||||||
| Terminal Value | 1,901 | |||||||||
| Present Terminal Value | 1,481 | |||||||||
| Enterprise Value | 1,761 | |||||||||
| Net Debt | 616 | |||||||||
| Equity Value | 1,145 | |||||||||
| Diluted Shares Outstanding, MM | 22 | |||||||||
| Equity Value Per Share | 51.49 |
What You Will Get
- Real SMP Financials: Access to historical and projected data for precise valuation.
- Customizable Inputs: Adjust WACC, tax rates, revenue growth, and capital expenditures as needed.
- Automatic Calculations: Intrinsic value and NPV are computed in real-time.
- Scenario Analysis: Explore various scenarios to assess Standard Motor Products, Inc.'s future performance.
- Clear and Intuitive Design: Designed for professionals while remaining user-friendly for newcomers.
Key Features
- Comprehensive DCF Calculator: Offers detailed unlevered and levered DCF valuation models tailored for Standard Motor Products, Inc. (SMP).
- WACC Calculator: Features a pre-built Weighted Average Cost of Capital sheet with adjustable inputs specific to SMP.
- Customizable Forecast Assumptions: Easily modify growth rates, capital expenditures, and discount rates to fit SMP's financial outlook.
- Integrated Financial Ratios: Evaluate profitability, leverage, and efficiency ratios pertinent to Standard Motor Products, Inc. (SMP).
- Dynamic Dashboard and Charts: Visual representations summarize essential valuation metrics for straightforward analysis of SMP.
How It Works
- Download the Template: Gain immediate access to the Excel-based SMP DCF Calculator.
- Input Your Assumptions: Modify the yellow-highlighted cells for growth rates, WACC, margins, and other key factors.
- Instant Calculations: The model automatically recalculates Standard Motor Products' intrinsic value.
- Test Scenarios: Experiment with various assumptions to see how they affect potential valuation outcomes.
- Analyze and Decide: Leverage the results to inform your investment or financial analysis decisions.
Why Choose This Calculator for Standard Motor Products, Inc. (SMP)?
- Accurate Data: Up-to-date Standard Motor Products financials provide trustworthy valuation outcomes.
- Customizable: Tailor essential parameters such as growth rates, WACC, and tax rates to fit your forecasts.
- Time-Saving: Pre-configured calculations remove the hassle of starting from the ground up.
- Professional-Grade Tool: Crafted for investors, analysts, and consultants in the automotive sector.
- User-Friendly: Simple design and clear step-by-step guidance make it accessible for everyone.
Who Should Use This Product?
- Individual Investors: Make informed decisions about buying or selling Standard Motor Products, Inc. (SMP) stock.
- Financial Analysts: Streamline valuation processes with ready-to-use financial models for Standard Motor Products, Inc. (SMP).
- Consultants: Deliver professional valuation insights regarding Standard Motor Products, Inc. (SMP) to clients quickly and accurately.
- Business Owners: Understand how companies like Standard Motor Products, Inc. (SMP) are valued to guide your own strategy.
- Finance Students: Learn valuation techniques using real-world data and scenarios related to Standard Motor Products, Inc. (SMP).
What the Template Contains
- Comprehensive DCF Model: Editable template featuring detailed valuation calculations tailored for Standard Motor Products, Inc. (SMP).
- Real-World Data: Standard Motor Products’ historical and projected financials preloaded for in-depth analysis.
- Customizable Parameters: Modify WACC, growth rates, and tax assumptions to explore various scenarios.
- Financial Statements: Complete annual and quarterly breakdowns for enhanced insights.
- Key Ratios: Integrated analysis for profitability, efficiency, and leverage metrics.
- Dashboard with Visual Outputs: Charts and tables designed for clear, actionable results.
Disclaimer
All information, articles, and product details provided on this website are for general informational and educational purposes only. We do not claim any ownership over, nor do we intend to infringe upon, any trademarks, copyrights, logos, brand names, or other intellectual property mentioned or depicted on this site. Such intellectual property remains the property of its respective owners, and any references here are made solely for identification or informational purposes, without implying any affiliation, endorsement, or partnership.
We make no representations or warranties, express or implied, regarding the accuracy, completeness, or suitability of any content or products presented. Nothing on this website should be construed as legal, tax, investment, financial, medical, or other professional advice. In addition, no part of this site—including articles or product references—constitutes a solicitation, recommendation, endorsement, advertisement, or offer to buy or sell any securities, franchises, or other financial instruments, particularly in jurisdictions where such activity would be unlawful.
All content is of a general nature and may not address the specific circumstances of any individual or entity. It is not a substitute for professional advice or services. Any actions you take based on the information provided here are strictly at your own risk. You accept full responsibility for any decisions or outcomes arising from your use of this website and agree to release us from any liability in connection with your use of, or reliance upon, the content or products found herein.