
|
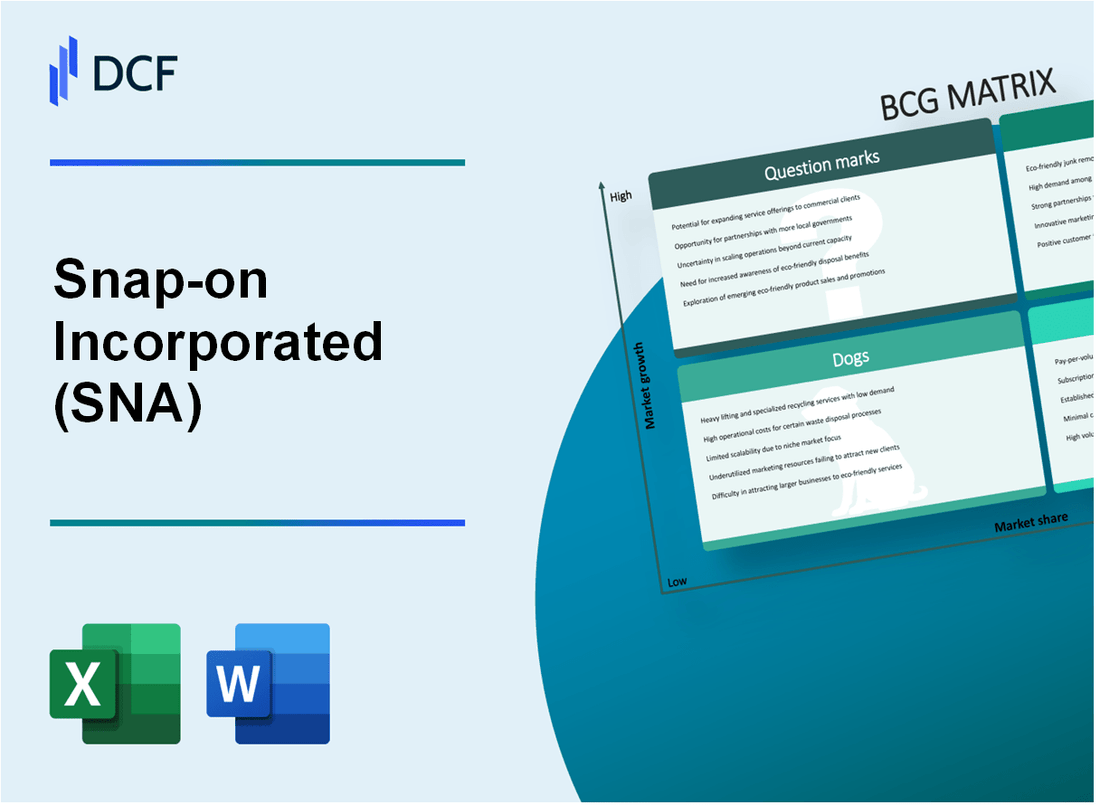
Snap-on Incorporated (SNA): BCG Matrix [Dec-2025 Updated] |
Fully Editable: Tailor To Your Needs In Excel Or Sheets
Professional Design: Trusted, Industry-Standard Templates
Investor-Approved Valuation Models
MAC/PC Compatible, Fully Unlocked
No Expertise Is Needed; Easy To Follow
Snap-on Incorporated (SNA) Bundle
Honestly, you're looking at a portfolio split right down the middle: Snap-on Incorporated is successfully milking its core franchise, the Snap-on Tools Group Cash Cow, which posted $506.0 million in Q3 2025 sales with stable but slow 1.0% growth, while simultaneously pouring resources into the high-octane Repair Systems & Information Group Star, which delivered a sharp 8.9% organic sales increase. Still, the map isn't all green; the Commercial & Industrial Group Dog is lagging with a 0.8% sales dip, and big capital expenditures, projected near $100 million for 2025, are being funneled into the high-risk Question Marks hoping they mature into the next Star. Let's break down exactly where the cash is coming from and where the next big fight for market share will be.
Background of Snap-on Incorporated (SNA)
You're looking at Snap-on Incorporated (SNA), which, since its founding back in 1920, has established itself as a major player in professional tools and equipment. Honestly, Snap-on isn't just selling wrenches; they are a leading global innovator, manufacturer, and marketer of tools, equipment, diagnostics, repair information, and systems solutions. Their core users are professionals performing critical tasks across vehicle repair, aerospace, the military, natural resources, and manufacturing. It's definitely a premium brand recognized as the mark of the serious professional.
The way Snap-on gets its products to market is pretty unique. You'll see their offerings sold through a widely recognized network of franchisee vans, which is a huge part of their connection to the end-user. Plus, they use direct and distributor channels under various notable brands. To help facilitate these sales and support the franchise model, Snap-on Incorporated also provides financing programs. The company is headquartered in Kenosha, Wisconsin, and you can find its stock trading on the New York Stock Exchange under the ticker SNA.
Looking at the most recent figures we have, which cover through the third quarter of 2025, the picture shows resilience amid some market choppiness. For the twelve months ending September 30, 2025, Snap-on reported revenue of $4.710B, which was a slight increase of 0.1% year-over-year. For context, their full-year 2024 sales were $4,707.4 million. The second quarter of 2025 specifically saw net sales of $1,179.4 million, which was flat compared to the prior year, though this masked an organic sales decline of 0.7%, balanced by favorable currency translation.
Operationally, the company is structured around a few key segments: the Commercial & Industrial Group, the Snap-on Tools Group, the Repair Systems & Information Group, and Financial Services. Management is focused on clear growth runways, which means enhancing that franchise network, deepening relationships with repair shop owners and managers, and expanding into critical industries and emerging markets. They lean heavily on proprietary processes like Rapid Continuous Improvement (RCI) to drive efficiency and boost margins. For the full year 2025, analysts were estimating a year-over-year drop in earnings per share of about 2%, but the company still maintains strong profitability metrics, with Q2 2025 consolidated operating earnings hitting $327.3 million.
Snap-on Incorporated (SNA) - BCG Matrix: Stars
You're looking at the segment of Snap-on Incorporated (SNA) that is currently dominating a rapidly expanding space, which is why we categorize the Repair Systems & Information Group (RS&I) as a Star. This unit is characterized by high market share in a market that's still growing fast, meaning it demands heavy investment to keep that lead. If this growth rate eventually slows, this unit is perfectly positioned to transition into a Cash Cow for the company.
The latest figures from the third quarter of 2025 clearly show this momentum. The RS&I segment posted sales of $464.8 million for the quarter. This performance was underpinned by a significant organic sales increase of 8.9%, which management noted was driven by higher activity with OEM dealerships and increased sales of diagnostic and repair information products. Honestly, this segment is where a lot of the future value is being built right now.
| Metric | Q3 2025 Value | Comparison/Context |
| RS&I Segment Sales | $464.8 million | Up 10.0% as reported from Q3 2024 |
| Organic Sales Growth | 8.9% | Accelerated from 2.3% in Q2 2025 |
| Operating Earnings | $141.2 million | Included a $22.0 million benefit from a legal settlement |
| Adjusted Operating Margin | 25.6% | Up 20 basis points year-over-year, excluding the legal effect |
The need for significant, ongoing investment is defintely clear here. To maintain its leadership in complex vehicle diagnostics and software, Snap-on Incorporated must continuously fund research and development to keep pace with evolving automotive technology. This is the cost of being the market leader in a high-growth area.
Here's a look at the key drivers and investment requirements for this Star segment:
- Dominant position in complex vehicle diagnostics software.
- OEM dealership sales grew by double digits in Q3 2025.
- Strong performance from new products like the new TRITON handheld.
- The vehicle parc averages nearly 12.8 years, increasing repair complexity.
- Requires capital to support innovation against rapidly changing tech.
You see, the high growth rate means cash flow in is often matched by cash flow out for promotion and placement, keeping the net cash flow neutral for now. If Snap-on Incorporated can sustain this success until the market growth rate naturally decelerates, the RS&I Group will become a powerful Cash Cow, generating substantial returns with less required reinvestment.
Snap-on Incorporated (SNA) - BCG Matrix: Cash Cows
You're looking at the bedrock of Snap-on Incorporated's financial stability here. The Snap-on Tools Group, which is the core franchise business, posted third quarter 2025 sales of $506.0 million. This segment shows the classic Cash Cow profile: high market share in a mature space, resulting in low growth, specifically an organic growth rate of only 1.0% in Q3 2025. Still, the segment's operating earnings were $109.9 million for the quarter, with an operating margin of 21.7%, showing strong profitability from that established position.
This segment benefits from extremely high brand equity and market share in professional hand tools and tool storage, which translates directly into consistent revenue streams. Honestly, when you see sales increase by 1.1% year-over-year to reach that $506.0 million mark, you know you have a stable asset. The overall corporation's organic sales growth was 3.0%, so the Tools Group is growing slightly slower than the company average, which fits the low-growth quadrant. Here's a quick look at how the major operating segments stacked up in Q3 2025:
| Segment | Q3 2025 Sales (Millions) | Q3 2025 Operating Earnings (Millions) |
| Snap-on Tools Group | $506.0 million | $109.9 million |
| Repair Systems & Information Group | $464.8 million | $141.2 million |
| Commercial & Industrial Group | $367.7 million | $57.5 million |
The Financial Services segment is definitely a high-margin asset that exemplifies the 'milking' strategy. This unit generated operating earnings of $68.9 million in Q3 2025 on revenue of $101.1 million. While the operating earnings were slightly down from $71.7 million in Q3 2024, the segment still provides stable, predictable cash flow, which is the primary function of a Cash Cow. That $68.9 million flows up to support the rest of the business structure.
These Cash Cows are the units that generate more cash than they consume, funding the rest of the portfolio. You can see the cash-generating power in these key metrics:
- Consolidated Operating Earnings for Q3 2025: $347.4 million.
- Operating Earnings Before Financial Services: $278.5 million.
- Financial Services Operating Earnings Margin (Approximate): 68.1% ($68.9M / $101.1M).
- Projected 2025 Capital Expenditures: Approximately $100 million for the full year.
The cash generated here is what Snap-on Incorporated uses to invest in its Stars-like the Repair Systems & Information Group, which saw sales jump 10.0%-and to cover the administrative costs of the entire corporation. This segment's performance is what allows management to maintain productivity levels without stressing growth-oriented units. Finance: draft 13-week cash view by Friday.
Snap-on Incorporated (SNA) - BCG Matrix: Dogs
You're looking at the units that aren't pulling their weight, the ones that tie up capital without delivering much return. For Snap-on Incorporated (SNA), the Commercial & Industrial Group (C&I) segment presents characteristics aligning with the Dog quadrant: low growth and low market share in certain sub-segments. Expensive turn-around plans usually don't help these areas, so management must decide whether to harvest or divest.
The C&I segment's recent performance defintely shows this pressure. In the third quarter of 2025, the segment experienced an organic sales decline of 0.8%. This was primarily driven by underperforming business in the Asia Pacific region. Still, the segment's total sales were $367.7 million in Q3 2025, up slightly from $365.7 million in Q3 2024, thanks to a favorable foreign currency translation effect of $4.8 million.
The core issue for this segment, as a Dog candidate, is its low market share in certain general industrial or international sub-segments where overall market growth is low. This lack of momentum directly impacts profitability metrics. Operating earnings for the C&I segment fell to $57.5 million in Q3 2025, down from $61.0 million reported in Q3 2024. This drop is clear when you look at the margin compression.
Here's a quick look at the C&I segment's Q3 performance comparison:
| Metric | Q3 2025 Value | Q3 2024 Value |
| Segment Sales | $367.7 million | $365.7 million |
| Organic Sales Change | -0.8% | Not explicitly stated as a percentage change for Q3 2024 |
| Operating Earnings | $57.5 million | $61.0 million |
| Operating Margin (% of Sales) | 15.6% | 16.7% |
The erosion in operating margin from 16.7% to 15.6% shows that even with a slight lift from currency, the underlying business activity is struggling. The segment's gross profit also saw a minor dip, coming in at $150.5 million in Q3 2025 compared to $150.8 million in Q3 2024. This unit frequently breaks even, neither earning nor consuming much cash, but it traps capital that could be better deployed elsewhere.
You can see the specific financial pressures contributing to the Dog classification:
- Organic sales decline: 0.8% in Q3 2025.
- Operating earnings decline: $57.5 million versus $61.0 million year-over-year.
- Operating margin contraction: 110 basis points decrease.
- Primary driver: Reductions in the Asia Pacific business.
Snap-on Incorporated (SNA) - BCG Matrix: Question Marks
You're looking at business units or product lines that are currently consuming cash but hold the promise of becoming future Stars. These are areas where Snap-on Incorporated is actively placing bets for high growth, but market share is not yet secured.
The strategy here is clear: invest heavily to capture market share quickly or risk them decaying into Dogs. For 2025, Snap-on Incorporated is allocating significant resources to these high-potential, high-need areas.
Expansion into new, adjacent critical industries like aerospace and manufacturing represents a core Question Mark focus. These markets demand high-reliability, precision tools where the cost of failure is substantial, justifying premium offerings. The Commercial & Industrial Group serves these sectors, which include aerospace, government, and military applications. Snap-on Industrial was showcasing specialized torque products at the AERO Friedrichshafen 2025 exhibition, signaling active engagement in this high-growth space.
New product lines are the tangible manifestation of this strategy. Consider the specialty torque operation within the Commercial & Industrial Group, which is progressing well.
Here are some examples of these growth-focused product introductions:
- Heavy-duty cordless torque multiplier, the CTM 800, expanding in torque capability.
- The CTM550 torque multiplier, noted as 66% lighter and 20% smaller than its predecessor.
- Next generation, 1/4-inch drive 14.4-volt cordless ratchets.
These new tools require market adoption to prove their value proposition against established competitors, fitting the low relative market share profile of a Question Mark.
The capital required to fuel this growth is substantial, directly reflecting the need for heavy investment to gain share quickly. Snap-on Incorporated projects capital expenditures for 2025 to approximate $100 million. This investment supports the overall growth runways, including emerging market expansion initiatives.
Here's a quick look at the financial context surrounding these Question Mark investments as of the latest reported data:
| Metric | Value (2025) | Context/Period |
| Projected 2025 Capital Expenditures | $100 million | Full Year Projection |
| Q3 2025 Net Sales | $1,190.8 million | Third Quarter |
| Year-to-Date Free Cash Flow | $715.2 million | Through Q3 2025 |
| Forward Price-to-Earnings Ratio | 17.12X | Valuation Metric |
The focus for these Question Marks is on achieving rapid market penetration in these growing areas. Management is actively working to enhance the franchise network, deepen relationships with repair shop owners and managers, and expand in these critical, high-stakes industries.
The required actions for these segments involve strategic resource allocation:
- Invest heavily to drive adoption of new products like the CTM 800.
- Expand connections with professional customers in adjacent markets and geographies.
- Ensure new product development aligns with the needs of modern, complex vehicle repairs.
- Monitor the success of the pivot to quick-payback items, which are gaining traction.
If these investments succeed, these segments move into the Star quadrant, characterized by high growth and high market share. If they fail to gain traction, they will consume capital without delivering returns, becoming Dogs.
Disclaimer
All information, articles, and product details provided on this website are for general informational and educational purposes only. We do not claim any ownership over, nor do we intend to infringe upon, any trademarks, copyrights, logos, brand names, or other intellectual property mentioned or depicted on this site. Such intellectual property remains the property of its respective owners, and any references here are made solely for identification or informational purposes, without implying any affiliation, endorsement, or partnership.
We make no representations or warranties, express or implied, regarding the accuracy, completeness, or suitability of any content or products presented. Nothing on this website should be construed as legal, tax, investment, financial, medical, or other professional advice. In addition, no part of this site—including articles or product references—constitutes a solicitation, recommendation, endorsement, advertisement, or offer to buy or sell any securities, franchises, or other financial instruments, particularly in jurisdictions where such activity would be unlawful.
All content is of a general nature and may not address the specific circumstances of any individual or entity. It is not a substitute for professional advice or services. Any actions you take based on the information provided here are strictly at your own risk. You accept full responsibility for any decisions or outcomes arising from your use of this website and agree to release us from any liability in connection with your use of, or reliance upon, the content or products found herein.