
|
Sopra Steria Group SA (SOP.PA) DCF Valuation |
Fully Editable: Tailor To Your Needs In Excel Or Sheets
Professional Design: Trusted, Industry-Standard Templates
Investor-Approved Valuation Models
MAC/PC Compatible, Fully Unlocked
No Expertise Is Needed; Easy To Follow
Sopra Steria Group SA (SOP.PA) Bundle
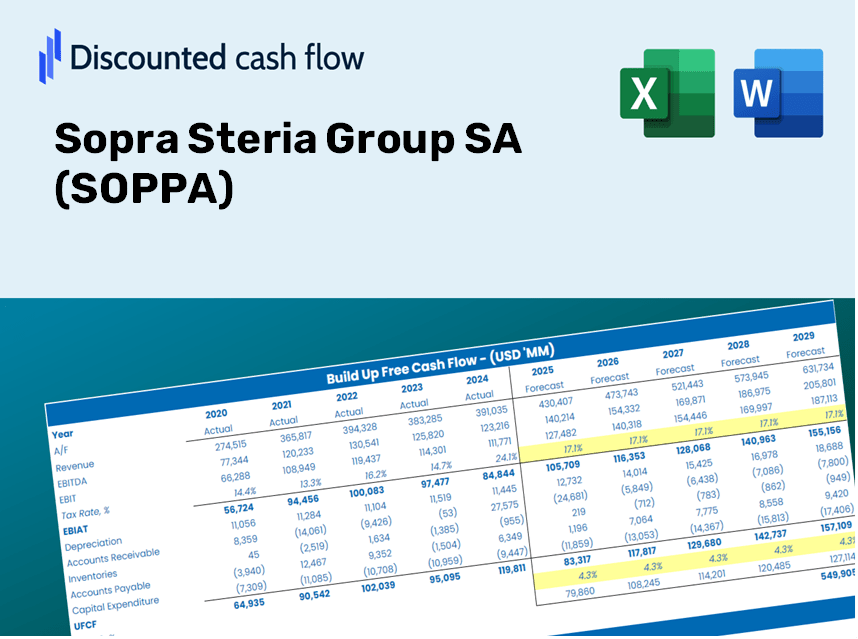
Streamline your analysis and improve precision with our (SOPPA) DCF Calculator! Utilizing real data from Sopra Steria Group SA and customizable assumptions, this tool empowers you to forecast, evaluate, and analyze (SOPPA) just like a seasoned investor.
Discounted Cash Flow (DCF) - (USD MM)
| Year | AY1 2020 |
AY2 2021 |
AY3 2022 |
AY4 2023 |
AY5 2024 |
FY1 2025 |
FY2 2026 |
FY3 2027 |
FY4 2028 |
FY5 2029 |
|---|---|---|---|---|---|---|---|---|---|---|
| Revenue | 4,262.9 | 4,682.8 | 5,101.2 | 5,805.3 | 5,776.8 | 6,240.3 | 6,741.1 | 7,282.0 | 7,866.3 | 8,497.5 |
| Revenue Growth, % | 0 | 9.85 | 8.93 | 13.8 | -0.49093 | 8.02 | 8.02 | 8.02 | 8.02 | 8.02 |
| EBITDA | 420.0 | 509.8 | 539.1 | 553.8 | 736.8 | 669.0 | 722.7 | 780.6 | 843.3 | 911.0 |
| EBITDA, % | 9.85 | 10.89 | 10.57 | 9.54 | 12.75 | 10.72 | 10.72 | 10.72 | 10.72 | 10.72 |
| Depreciation | 223.8 | 205.7 | 174.0 | 216.6 | 251.2 | 263.8 | 284.9 | 307.8 | 332.5 | 359.2 |
| Depreciation, % | 5.25 | 4.39 | 3.41 | 3.73 | 4.35 | 4.23 | 4.23 | 4.23 | 4.23 | 4.23 |
| EBIT | 196.2 | 304.1 | 365.1 | 337.2 | 485.6 | 405.2 | 437.7 | 472.9 | 510.8 | 551.8 |
| EBIT, % | 4.6 | 6.49 | 7.16 | 5.81 | 8.41 | 6.49 | 6.49 | 6.49 | 6.49 | 6.49 |
| Total Cash | 245.5 | 217.2 | 355.9 | 191.7 | 423.4 | 349.5 | 377.6 | 407.9 | 440.6 | 476.0 |
| Total Cash, percent | .0 | .0 | .0 | .0 | .0 | .0 | .0 | .0 | .0 | .0 |
| Account Receivables | 954.6 | 1,347.8 | 1,104.2 | 1,741.7 | 1,307.4 | 1,565.8 | 1,691.4 | 1,827.1 | 1,973.7 | 2,132.1 |
| Account Receivables, % | 22.39 | 28.78 | 21.65 | 30 | 22.63 | 25.09 | 25.09 | 25.09 | 25.09 | 25.09 |
| Inventories | 43.8 | 44.7 | 46.3 | 52.2 | 45.3 | 57.1 | 61.7 | 66.6 | 71.9 | 77.7 |
| Inventories, % | 1.03 | 0.95456 | 0.90763 | 0.89918 | 0.78417 | 0.9146 | 0.9146 | 0.9146 | 0.9146 | 0.9146 |
| Accounts Payable | 278.6 | 328.9 | 318.2 | 354.5 | 354.2 | 399.8 | 431.9 | 466.6 | 504.0 | 544.4 |
| Accounts Payable, % | 6.54 | 7.02 | 6.24 | 6.11 | 6.13 | 6.41 | 6.41 | 6.41 | 6.41 | 6.41 |
| Capital Expenditure | -53.6 | -54.6 | -94.2 | -100.6 | -74.8 | -91.1 | -98.4 | -106.3 | -114.8 | -124.0 |
| Capital Expenditure, % | -1.26 | -1.17 | -1.85 | -1.73 | -1.29 | -1.46 | -1.46 | -1.46 | -1.46 | -1.46 |
| Tax Rate, % | 40.47 | 40.47 | 40.47 | 40.47 | 40.47 | 40.47 | 40.47 | 40.47 | 40.47 | 40.47 |
| EBITAT | 118.4 | 200.1 | 260.8 | 210.6 | 289.1 | 259.0 | 279.8 | 302.2 | 326.5 | 352.7 |
| Depreciation | ||||||||||
| Changes in Account Receivables | ||||||||||
| Changes in Inventories | ||||||||||
| Changes in Accounts Payable | ||||||||||
| Capital Expenditure | ||||||||||
| UFCF | -431.2 | 7.4 | 571.9 | -280.5 | 906.4 | 207.2 | 368.2 | 397.7 | 429.6 | 464.1 |
| WACC, % | 6.49 | 6.59 | 6.68 | 6.53 | 6.48 | 6.55 | 6.55 | 6.55 | 6.55 | 6.55 |
| PV UFCF | ||||||||||
| SUM PV UFCF | 1,518.6 | |||||||||
| Long Term Growth Rate, % | 3.00 | |||||||||
| Free cash flow (T + 1) | 478 | |||||||||
| Terminal Value | 13,447 | |||||||||
| Present Terminal Value | 9,790 | |||||||||
| Enterprise Value | 11,308 | |||||||||
| Net Debt | 809 | |||||||||
| Equity Value | 10,499 | |||||||||
| Diluted Shares Outstanding, MM | 20 | |||||||||
| Equity Value Per Share | 516.38 |
What You Will Receive
- Adjustable Forecast Parameters: Effortlessly modify key inputs (growth %, margins, WACC) to explore various scenarios.
- Actual Market Data: Sopra Steria Group SA’s financial information pre-loaded to kickstart your analysis.
- Instant DCF Outputs: The model automatically computes Net Present Value (NPV) and intrinsic value for your convenience.
- Tailored and Professional: A refined Excel model designed to meet your valuation requirements.
- Designed for Analysts and Investors: Perfect for evaluating projections, verifying strategies, and maximizing efficiency.
Key Features
- Customizable Forecast Inputs: Adjust essential factors such as revenue growth, EBITDA percentage, and capital expenditures.
- Instant DCF Valuation: Automatically computes intrinsic value, net present value (NPV), and other key metrics.
- Industry-Leading Accuracy: Leverages Sopra Steria Group SA's (SOPPA) actual financial data for realistic valuation results.
- Effortless Scenario Analysis: Easily test various assumptions and evaluate different outcomes.
- Efficiency Booster: Remove the hassle of creating intricate valuation models from the ground up.
How It Works
- Step 1: Download the prebuilt Excel template featuring Sopra Steria Group SA’s (SOPPA) data.
- Step 2: Review the pre-filled sheets to familiarize yourself with the essential metrics.
- Step 3: Modify forecasts and assumptions in the editable yellow cells (WACC, growth, margins).
- Step 4: Instantly see the recalculated results, including Sopra Steria Group SA’s (SOPPA) intrinsic value.
- Step 5: Make informed investment decisions or create reports based on the outputs.
Why Opt for This Calculator?
- Designed for Experts: A sophisticated tool tailored for analysts, CFOs, and consultants.
- Accurate Financial Data: Historical and projected financials of Sopra Steria Group SA (SOPPA) are preloaded for precision.
- Flexible Scenario Analysis: Easily create and test various forecasts and assumptions.
- Comprehensive Outputs: Instantly calculates intrinsic value, NPV, and other essential metrics.
- User-Friendly: Step-by-step guidance helps you navigate the process effortlessly.
Who Can Benefit from This Product?
- Investors: Evaluate Sopra Steria Group SA's (SOPPA) valuation prior to making stock transactions.
- CFOs and Financial Analysts: Enhance valuation workflows and validate financial projections.
- Startup Founders: Discover the valuation methods applied to established firms like Sopra Steria Group SA.
- Consultants: Provide clients with comprehensive and professional valuation reports.
- Students and Educators: Utilize real-life data to teach and practice valuation strategies.
Contents of the Template
- Preloaded SOPPA Data: Historical and projected financial metrics, including revenue, EBIT, and capital expenditures.
- DCF and WACC Models: Professional-grade spreadsheets for determining intrinsic value and Weighted Average Cost of Capital.
- Editable Inputs: Yellow-highlighted fields for modifying revenue growth, tax rates, and discount rates.
- Financial Statements: Detailed annual and quarterly financial documents for thorough analysis.
- Key Ratios: Profitability, leverage, and efficiency ratios to assess performance.
- Dashboard and Charts: Visual representations of valuation results and underlying assumptions.
Disclaimer
All information, articles, and product details provided on this website are for general informational and educational purposes only. We do not claim any ownership over, nor do we intend to infringe upon, any trademarks, copyrights, logos, brand names, or other intellectual property mentioned or depicted on this site. Such intellectual property remains the property of its respective owners, and any references here are made solely for identification or informational purposes, without implying any affiliation, endorsement, or partnership.
We make no representations or warranties, express or implied, regarding the accuracy, completeness, or suitability of any content or products presented. Nothing on this website should be construed as legal, tax, investment, financial, medical, or other professional advice. In addition, no part of this site—including articles or product references—constitutes a solicitation, recommendation, endorsement, advertisement, or offer to buy or sell any securities, franchises, or other financial instruments, particularly in jurisdictions where such activity would be unlawful.
All content is of a general nature and may not address the specific circumstances of any individual or entity. It is not a substitute for professional advice or services. Any actions you take based on the information provided here are strictly at your own risk. You accept full responsibility for any decisions or outcomes arising from your use of this website and agree to release us from any liability in connection with your use of, or reliance upon, the content or products found herein.