
|
Supreme Petrochem Limited (SPLPETRO.NS) DCF Valuation |
Fully Editable: Tailor To Your Needs In Excel Or Sheets
Professional Design: Trusted, Industry-Standard Templates
Investor-Approved Valuation Models
MAC/PC Compatible, Fully Unlocked
No Expertise Is Needed; Easy To Follow
Supreme Petrochem Limited (SPLPETRO.NS) Bundle
Engineered for accuracy, our (SPLPETRONS) DCF Calculator enables you to evaluate Supreme Petrochem Limited's valuation using real-world financial data and offers complete flexibility to modify all essential parameters for enhanced projections.
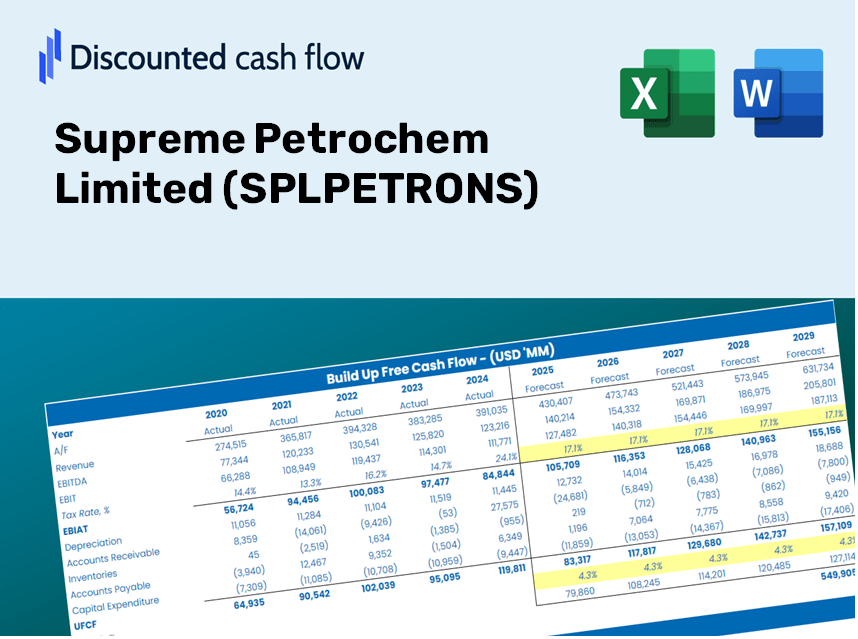
Discounted Cash Flow (DCF) - (USD MM)
| Year | AY1 2021 |
AY2 2022 |
AY3 2023 |
AY4 2024 |
AY5 2025 |
FY1 2026 |
FY2 2027 |
FY3 2028 |
FY4 2029 |
FY5 2030 |
|---|---|---|---|---|---|---|---|---|---|---|
| Revenue | 31,828.1 | 50,298.2 | 52,843.8 | 52,493.6 | 60,163.9 | 71,751.6 | 85,571.1 | 102,052.3 | 121,707.8 | 145,148.9 |
| Revenue Growth, % | 0 | 58.03 | 5.06 | -0.66275 | 14.61 | 19.26 | 19.26 | 19.26 | 19.26 | 19.26 |
| EBITDA | 6,609.3 | 8,936.0 | 6,574.8 | 4,447.4 | 5,054.5 | 9,736.3 | 11,611.5 | 13,847.9 | 16,515.1 | 19,695.9 |
| EBITDA, % | 20.77 | 17.77 | 12.44 | 8.47 | 8.4 | 13.57 | 13.57 | 13.57 | 13.57 | 13.57 |
| Depreciation | 238.5 | 238.3 | 263.7 | 367.7 | 418.4 | 447.4 | 533.6 | 636.4 | 759.0 | 905.1 |
| Depreciation, % | 0.7493 | 0.4737 | 0.49895 | 0.70055 | 0.6955 | 0.6236 | 0.6236 | 0.6236 | 0.6236 | 0.6236 |
| EBIT | 6,370.9 | 8,697.7 | 6,311.1 | 4,079.6 | 4,636.1 | 9,288.8 | 11,077.9 | 13,211.5 | 15,756.1 | 18,790.7 |
| EBIT, % | 20.02 | 17.29 | 11.94 | 7.77 | 7.71 | 12.95 | 12.95 | 12.95 | 12.95 | 12.95 |
| Total Cash | 5,724.1 | 8,689.2 | 9,683.7 | 10,727.6 | 8,722.1 | 12,702.7 | 15,149.2 | 18,067.0 | 21,546.7 | 25,696.7 |
| Total Cash, percent | .0 | .0 | .0 | .0 | .0 | .0 | .0 | .0 | .0 | .0 |
| Account Receivables | 3,849.9 | 4,117.8 | 3,750.6 | 4,093.2 | 4,128.6 | 6,032.9 | 7,194.8 | 8,580.6 | 10,233.2 | 12,204.2 |
| Account Receivables, % | 12.1 | 8.19 | 7.1 | 7.8 | 6.86 | 8.41 | 8.41 | 8.41 | 8.41 | 8.41 |
| Inventories | 3,178.1 | 3,007.6 | 6,469.3 | 4,806.0 | 7,008.0 | 7,033.2 | 8,387.8 | 10,003.3 | 11,929.9 | 14,227.7 |
| Inventories, % | 9.99 | 5.98 | 12.24 | 9.16 | 11.65 | 9.8 | 9.8 | 9.8 | 9.8 | 9.8 |
| Accounts Payable | 5,685.4 | 5,259.3 | 7,820.2 | 8,089.1 | 9,277.4 | 10,611.8 | 12,655.6 | 15,093.1 | 18,000.1 | 21,466.9 |
| Accounts Payable, % | 17.86 | 10.46 | 14.8 | 15.41 | 15.42 | 14.79 | 14.79 | 14.79 | 14.79 | 14.79 |
| Capital Expenditure | -262.4 | -1,633.2 | -2,057.9 | -3,130.9 | -3,763.3 | -2,896.6 | -3,454.5 | -4,119.8 | -4,913.3 | -5,859.6 |
| Capital Expenditure, % | -0.8243 | -3.25 | -3.89 | -5.96 | -6.26 | -4.04 | -4.04 | -4.04 | -4.04 | -4.04 |
| Tax Rate, % | 25.67 | 25.67 | 25.67 | 25.67 | 25.67 | 25.67 | 25.67 | 25.67 | 25.67 | 25.67 |
| EBITAT | 4,725.2 | 6,497.8 | 4,714.2 | 3,019.0 | 3,445.8 | 6,909.0 | 8,239.7 | 9,826.7 | 11,719.4 | 13,976.5 |
| Depreciation | ||||||||||
| Changes in Account Receivables | ||||||||||
| Changes in Inventories | ||||||||||
| Changes in Accounts Payable | ||||||||||
| Capital Expenditure | ||||||||||
| UFCF | 3,358.8 | 4,579.5 | 2,386.3 | 1,845.4 | -948.1 | 3,864.7 | 4,846.2 | 5,779.5 | 6,892.7 | 8,220.2 |
| WACC, % | 4.72 | 4.73 | 4.73 | 4.72 | 4.73 | 4.73 | 4.73 | 4.73 | 4.73 | 4.73 |
| PV UFCF | ||||||||||
| SUM PV UFCF | 25,397.1 | |||||||||
| Long Term Growth Rate, % | 2.00 | |||||||||
| Free cash flow (T + 1) | 8,385 | |||||||||
| Terminal Value | 307,672 | |||||||||
| Present Terminal Value | 244,249 | |||||||||
| Enterprise Value | 269,646 | |||||||||
| Net Debt | -3,323 | |||||||||
| Equity Value | 272,969 | |||||||||
| Diluted Shares Outstanding, MM | 188 | |||||||||
| Equity Value Per Share | 1,451.64 |
What You Will Receive
- Comprehensive Financial Model: Utilize Supreme Petrochem Limited’s actual data for accurate DCF valuation.
- Complete Forecast Control: Modify revenue growth, profit margins, WACC, and other essential factors.
- Real-Time Calculations: Automatic updates reflect your changes instantly for immediate results.
- Investor-Ready Template: A polished Excel file crafted for high-quality valuation.
- Customizable and Reusable: Designed for adaptability, allowing for repeated use in detailed forecasting.
Key Features
- Pre-Loaded Data: Supreme Petrochem Limited’s historical financial statements and pre-populated forecasts.
- Fully Adjustable Inputs: Modify WACC, tax rates, revenue growth, and EBITDA margins as needed.
- Instant Results: Watch Supreme Petrochem Limited’s intrinsic value recalculate dynamically in real time.
- Clear Visual Outputs: Dashboard charts illustrate valuation results and essential metrics.
- Designed for Precision: A professional-grade tool for analysts, investors, and finance professionals.
How It Functions
- Download the Template: Gain immediate access to the Excel-based SPLPETRONS DCF Calculator.
- Input Your Assumptions: Modify the yellow-highlighted cells for growth rates, WACC, margins, and additional parameters.
- Instant Calculations: The model automatically calculates the intrinsic value of Supreme Petrochem Limited (SPLPETRONS).
- Test Scenarios: Experiment with various assumptions to assess potential changes in valuation.
- Analyze and Decide: Utilize the outcomes to inform your investment or financial strategy.
Why Choose Supreme Petrochem Limited (SPLPETRONS)?
- Reliability: Comprehensive data from Supreme Petrochem ensures reliability in financial evaluation.
- Adaptability: Crafted for users to easily adjust and test various inputs.
- Efficiency: Eliminate the complexities of creating a financial model from the ground up.
- Expert-Level: Designed with the precision and functionality that CFOs demand.
- Intuitive: Simple to navigate, even for those new to financial modeling.
Who Should Use Supreme Petrochem Limited (SPLPETRONS)?
- Market Analysts: Deepen your understanding of petrochemical valuations with real-time data.
- Students in Economics: Explore industry-specific financial models relevant to petrochemicals for academic projects.
- Investors: Test your hypotheses and evaluate valuation trends for Supreme Petrochem Limited (SPLPETRONS).
- Financial Professionals: Optimize your research with a customizable DCF model tailored for petrochemical firms.
- Entrepreneurs: Learn how large public companies like Supreme Petrochem Limited (SPLPETRONS) are assessed in the market.
Contents of the Template
- Operating and Balance Sheet Data: Pre-filled historical data and forecasts for Supreme Petrochem Limited (SPLPETRONS), including revenue, EBITDA, EBIT, and capital expenditures.
- WACC Calculation: A dedicated sheet for the Weighted Average Cost of Capital (WACC), encompassing parameters such as Beta, risk-free rate, and share price.
- DCF Valuation (Unlevered and Levered): Customizable Discounted Cash Flow models that reveal intrinsic value along with detailed calculations.
- Financial Statements: Pre-loaded annual and quarterly financial statements to facilitate thorough analysis.
- Key Ratios: A compilation of profitability, leverage, and efficiency ratios for Supreme Petrochem Limited (SPLPETRONS).
- Dashboard and Charts: Visual summaries of valuation outputs and assumptions for easy results analysis.
Disclaimer
All information, articles, and product details provided on this website are for general informational and educational purposes only. We do not claim any ownership over, nor do we intend to infringe upon, any trademarks, copyrights, logos, brand names, or other intellectual property mentioned or depicted on this site. Such intellectual property remains the property of its respective owners, and any references here are made solely for identification or informational purposes, without implying any affiliation, endorsement, or partnership.
We make no representations or warranties, express or implied, regarding the accuracy, completeness, or suitability of any content or products presented. Nothing on this website should be construed as legal, tax, investment, financial, medical, or other professional advice. In addition, no part of this site—including articles or product references—constitutes a solicitation, recommendation, endorsement, advertisement, or offer to buy or sell any securities, franchises, or other financial instruments, particularly in jurisdictions where such activity would be unlawful.
All content is of a general nature and may not address the specific circumstances of any individual or entity. It is not a substitute for professional advice or services. Any actions you take based on the information provided here are strictly at your own risk. You accept full responsibility for any decisions or outcomes arising from your use of this website and agree to release us from any liability in connection with your use of, or reliance upon, the content or products found herein.