
|
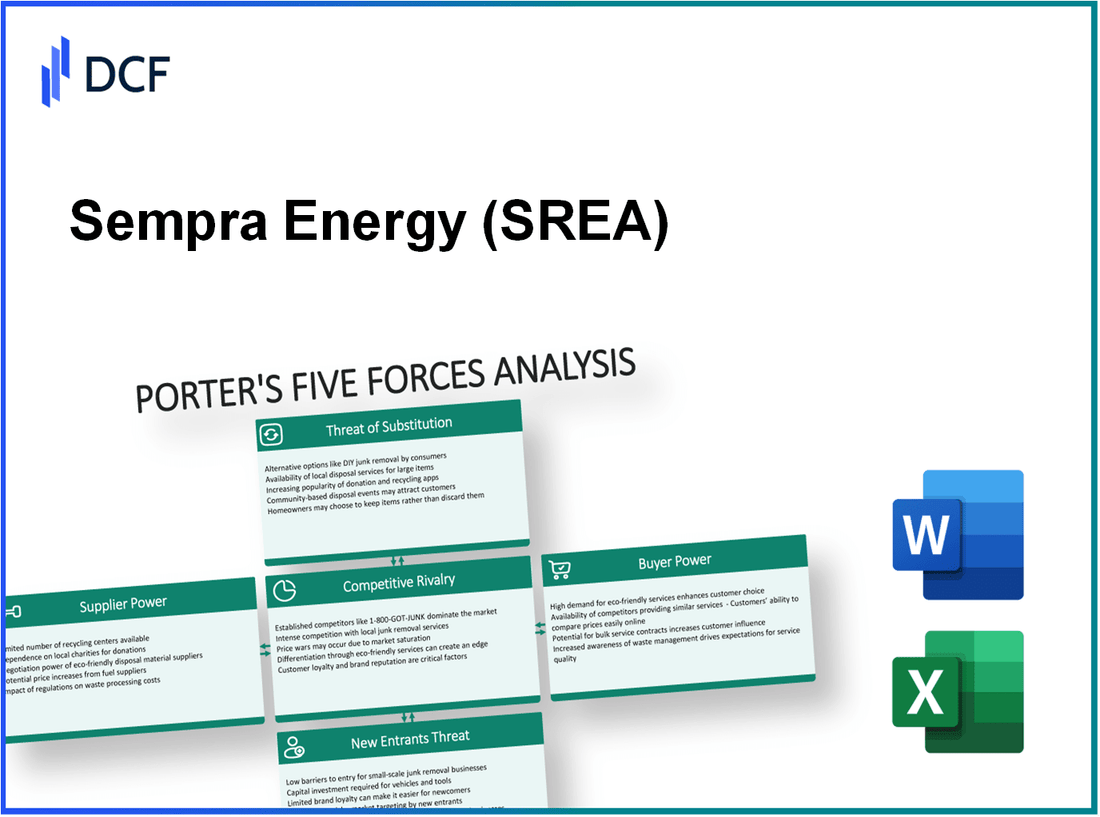
SEMPRA ENERGY (SREA): Porter's 5 Forces Analysis |
Fully Editable: Tailor To Your Needs In Excel Or Sheets
Professional Design: Trusted, Industry-Standard Templates
Investor-Approved Valuation Models
MAC/PC Compatible, Fully Unlocked
No Expertise Is Needed; Easy To Follow
Sempra Energy (SREA) Bundle
In the ever-evolving landscape of the energy sector, understanding the competitive dynamics at play is crucial for investors and stakeholders alike. Sempra Energy, a key player in this field, navigates a complex web of market forces—from the bargaining power of suppliers and customers to the competitive rivalry and threats posed by substitutes and new entrants. Dive into the intricacies of Michael Porter’s Five Forces Framework as we dissect the elements shaping Sempra Energy's strategic positioning and operational resilience.
SEMPRA ENERGY - Porter's Five Forces: Bargaining power of suppliers
The bargaining power of suppliers in the energy sector, specifically for Sempra Energy, presents several critical dynamics impacting pricing and contract negotiations.
Limited alternative suppliers for energy infrastructure
Sempra Energy operates within a sector where the number of suppliers for energy infrastructure is limited. The company relies on specialized companies for large-scale construction and maintenance of energy infrastructure, such as pipelines and power generation facilities. As of 2023, Sempra has reported commitments exceeding $24 billion in capital investments toward gas and renewable energy infrastructure, indicating a continual reliance on these specialized suppliers.
High switching costs for specialized equipment
The energy industry often requires significant investments in specialized equipment and technology. This results in high switching costs when attempting to change suppliers. Sempra's infrastructure investments include advanced technologies for renewable energy, such as battery storage systems. The costs associated with switching suppliers can exceed $10 million for major equipment, thereby solidifying existing supplier relationships.
Long-term contracts reduce supplier power
Sempra utilizes long-term contracts with its suppliers to mitigate the power suppliers have in price negotiations. As per the latest financial report, approximately 70% of Sempra’s supply chain is governed by contracts that last over five years. These long-term agreements stabilize costs and reduce the potential for price volatility.
Regulatory standards limit supplier influence
The energy sector is heavily regulated, which impacts supplier influence. Regulatory standards, such as those set by the California Public Utilities Commission, impose strict guidelines on suppliers concerning pricing and quality. For instance, compliance costs related to these regulations can increase supplier overhead, thus limiting their ability to exert pressure on prices.
Potential for supplier consolidation increases power
The threat of supplier consolidation poses a risk to Sempra Energy's bargaining power. Recent trends indicate a move towards consolidation within the energy supply chain. In 2022, the merger between two major equipment suppliers resulted in an estimated market share increase of 15% in the sector. Such consolidation can elevate supplier power, giving them greater control over pricing strategies.
| Factor | Impact on Supplier Power | Statistics/Financial Data |
|---|---|---|
| Limited Alternative Suppliers | Increases supplier power | Capital commitments over $24 billion in infrastructure |
| High Switching Costs | Increases supplier power | Switching costs can exceed $10 million |
| Long-term Contracts | Reduces supplier power | Approximately 70% under long-term contracts |
| Regulatory Standards | Limits supplier influence | Compliance costs increase supplier overhead |
| Supplier Consolidation | Increases supplier power | Estimated 15% market share increase post-merger |
SEMPRA ENERGY - Porter's Five Forces: Bargaining power of customers
The bargaining power of customers is an essential factor that impacts Sempra Energy's business dynamics. As the demand for energy shifts, customers are becoming increasingly influential in setting terms and prices.
Increasing demand for clean energy options
According to the U.S. Energy Information Administration (EIA), renewable energy consumption in the U.S. increased by 44% from 2020 to 2021. This trend reflects a growing customer preference for cleaner energy sources.
Growing customer awareness impacts service choices
Research from the International Energy Agency (IEA) indicates that 76% of consumers are now willing to switch providers for greener options. This awareness drives competition among utility companies, including Sempra Energy, to offer sustainable solutions.
Availability of alternative energy providers enhances power
In 2022, over 25% of U.S. energy consumers utilized alternative energy suppliers, leading to heightened competition. Sempra Energy faces challenges as customers increasingly explore other options, thereby increasing their bargaining power.
Regulatory influences on pricing benefit customers
California Public Utilities Commission regulations allow customers to negotiate rates and seek alternative energy solutions. Sempra Energy's residential rates average around $0.21 per kWh, while customers benefit from mandated price transparency that could lead to lower rates.
Large commercial clients possess more negotiating power
Corporate clients, such as large manufacturers, represent over 30% of Sempra's revenue. Their negotiating leverage stems from the ability to commit to long-term contracts or pivot to competitors, emphasizing the importance of maintaining competitive pricing and services.
| Factor | Details | Impact on Customer Bargaining Power |
|---|---|---|
| Demand for Clean Energy | Renewable energy consumption increased by 44% (2020-2021) | Higher demand leads to more choices for customers |
| Customer Awareness | 76% willing to switch for greener options | Increases pressure on Sempra to adopt clean energy |
| Alternative Providers | 25% of consumers use alternative energy suppliers | Increased competition enhances customer power |
| Regulatory Influences | Residential rates average $0.21 per kWh | Regulations facilitate price negotiation |
| Large Commercial Clients | Accounts for over 30% of revenue | Greater negotiating power due to bulk purchasing |
As customers continue to prioritize sustainable practices, their bargaining power will likely grow, necessitating strategic adjustments within Sempra Energy's business model.
SEMPRA ENERGY - Porter's Five Forces: Competitive rivalry
The competitive landscape for Sempra Energy is characterized by high competition from several other major energy companies. As of 2023, the largest competitors in the U.S. energy market include Duke Energy, Southern Company, and Dominion Energy, all of which have substantial market shares and diverse energy portfolios. For instance, Duke Energy reported a total revenue of approximately $25.1 billion in 2022, while Southern Company generated $23.7 billion in the same year.
Demand for innovation in renewable energy sources has intensified the competitive rivalry within the sector. Sempra Energy’s investments in renewable projects, amounting to over $5 billion in the last five years, are a direct response to competitors like NextEra Energy, which reported a renewable energy sales growth of 11% year-over-year in 2022, highlighting shifting consumer preferences towards cleaner energy options.
Market saturation in certain regions further escalates competition among energy providers. In California, where Sempra operates as San Diego Gas & Electric, the market is highly penetrated, with a reported 92% of electricity sales coming from the top three utilities. This saturation leads to aggressive marketing tactics and service offers as companies vie for customer loyalty.
Price wars are a looming possibility due to market pressures and the need to maintain competitive pricing. The average residential electricity price in California was about $0.25 per kWh in 2022, among the highest in the U.S., which can lead to increased competition over price adjustments. In contrast, Texas saw prices around $0.14 per kWh, prompting more aggressive pricing strategies among California utilities.
To counteract competitive pressures, differentiation through sustainability initiatives has become crucial. Sempra is committed to investing in sustainable technologies, emphasizing its 40% reduction target in greenhouse gas emissions by 2030. Competitors are also implementing similar strategies, such as Duke Energy's goal of achieving net-zero emissions by 2050 and Southern Company's investment of $5 billion in renewable energy projects by 2025.
| Company | Total Revenue (2022) | Renewable Investments (last 5 years) | Net-Zero Emissions Target |
|---|---|---|---|
| Duke Energy | $25.1 billion | $10 billion | 2050 |
| Southern Company | $23.7 billion | $5 billion (by 2025) | 2050 |
| NextEra Energy | $19.2 billion | $40 billion (2021-2025) | 2050 |
| Sempra Energy | $16.7 billion | $5 billion (last 5 years) | 2030 |
This competitive dynamic requires Sempra Energy to continuously innovate and adapt its strategies to maintain its market position and profitability amid growing challenges and opportunities in the energy sector.
SEMPRA ENERGY - Porter's Five Forces: Threat of substitutes
The threat of substitutes is a critical factor in assessing the competitive landscape for Sempra Energy. As consumer preferences shift towards more sustainable and cost-effective energy solutions, the landscape is evolving rapidly.
Rising availability of renewable energy sources
The availability of renewable energy sources has significantly increased. In 2022, renewable energy sources accounted for approximately 20% of the total electricity consumption in the United States, up from 18% in 2021. This rise creates a robust substitute for traditional fossil fuels.
Technological advancements in solar and wind energy
Technological innovations have drastically reduced the cost of renewable energy production. For instance, the levelized cost of energy (LCOE) for onshore wind and solar photovoltaics fell to approximately $26 per megawatt-hour (MWh) and $36 per MWh, respectively, as reported by the U.S. Department of Energy in 2021. Such advancements make renewables more attractive compared to traditional energy sources.
Energy efficiency improvements reduce overall demand
Energy efficiency improvements have led to a decrease in overall energy demand. According to the American Council for an Energy-Efficient Economy, US energy efficiency standards have resulted in savings of about $900 billion in energy costs since 1980, with an additional reduction of about 1.2 billion metric tons of carbon dioxide emissions in 2020 alone. Less demand for energy diminishes the reliance on traditional energy suppliers like Sempra Energy.
Increasing adoption of home-based energy solutions
The adoption of home-based energy solutions, such as solar panels and home battery systems, is gaining momentum. In 2022, approximately 4 million U.S. homes utilized solar panels, marking a growth of 20% from 2021. Moreover, the global market for home energy storage systems is projected to reach $4.4 billion by 2026, presenting a viable substitute to grid-supplied electricity.
Government incentives for alternative energies weaken traditional offerings
Government initiatives, such as the Investment Tax Credit (ITC) and various state-level subsidies, are promoting the adoption of alternative energies. The ITC allowed for a 26% tax credit for solar project installations in 2022. These incentives can diminish the competitiveness of traditional energy offerings from companies like Sempra Energy.
| Factor | 2021 Data | 2022 Data | Forecast for 2026 |
|---|---|---|---|
| Renewable Energy Contribution to US Electricity | 18% | 20% | N/A |
| Cost of Onshore Wind LCOE | $39/MWh | $26/MWh | N/A |
| Cost of Solar PV LCOE | $46/MWh | $36/MWh | N/A |
| U.S. Homes with Solar Panels | 3.3 million | 4 million | 6 million |
| Home Energy Storage Market by 2026 | N/A | N/A | $4.4 billion |
| Investment Tax Credit for Solar | 22% | 26% | 30% (2023 and beyond) |
SEMPRA ENERGY - Porter's Five Forces: Threat of new entrants
The threat of new entrants in the energy sector, particularly for Sempra Energy, is influenced by several factors that impact their market dynamics.
High capital requirements deter new entrants
The energy sector requires significant capital investment for infrastructure, technology, and regulatory compliance. Sempra Energy's total capital expenditures reached approximately $3.4 billion in 2022 alone. To establish a similar scale of operations, new entrants would need to invest heavily, often exceeding billions of dollars, which serves as a substantial barrier to entry.
Regulatory barriers complicate market entry
The energy industry is heavily regulated at both federal and state levels. For example, the Federal Energy Regulatory Commission (FERC) oversees various aspects of energy markets. Compliance with regulations such as the Clean Air Act and state-specific regulations incurs additional costs. In California, where Sempra operates, regulations require adherence to strict environmental standards and utilities must obtain approval for new projects, lengthening the timeline and increasing the complexity of market entry.
Established brand loyalty challenges new entrants
Sempra Energy has built a strong brand presence in the markets it operates. With over 35 million customers, primarily in California and Texas, brand loyalty plays a significant role. Established companies benefit from customer retention, as switching costs can discourage customers from moving to a new provider, thereby hindering new entrants from gaining market share.
Economies of scale favor existing players
Existing firms like Sempra benefit from economies of scale that reduce per-unit costs. With an annual revenue of approximately $17.6 billion in 2022, Sempra can operate at a lower cost per unit compared to potential new entrants, who would be operating at a smaller scale initially since they lack customer bases and established systems.
Technological advancements lower entry barriers for innovative firms
While traditional energy markets face high entry barriers, technological advancements such as renewable energy technologies and smart grid innovations can create new avenues for entry. Sempra's investments in renewable energy projects include a commitment of $1.5 billion towards solar and wind energy initiatives over the next few years. This investment may encourage new entrants focused on niche markets but still requires substantial initial investment and expertise.
| Factor | Description | Impact on New Entrants |
|---|---|---|
| Capital Requirements | Need for billions to establish infrastructure | High barrier to entry |
| Regulatory Barriers | Federal and state regulations compliance | Increases complexity and costs |
| Brand Loyalty | Strong customer base of 35 million | Challenges for market penetration |
| Economies of Scale | Annual revenue of $17.6 billion | Lower costs for established players |
| Technological Advancements | Investment of $1.5 billion in renewables | Opens niche markets |
Understanding the dynamics of Sempra Energy through Porter's Five Forces reveals a complex interplay of market factors that shape its competitive landscape. From the powerful influence of suppliers and customers to the intense rivalry and the growing threat from substitutes and new entrants, each element underscores the critical need for Sempra to innovate and adapt. In this ever-evolving energy sector, strategic agility and a commitment to sustainability will be essential for Sempra to thrive in a market increasingly defined by shifting consumer preferences and technological advancements.
[right_small]Disclaimer
All information, articles, and product details provided on this website are for general informational and educational purposes only. We do not claim any ownership over, nor do we intend to infringe upon, any trademarks, copyrights, logos, brand names, or other intellectual property mentioned or depicted on this site. Such intellectual property remains the property of its respective owners, and any references here are made solely for identification or informational purposes, without implying any affiliation, endorsement, or partnership.
We make no representations or warranties, express or implied, regarding the accuracy, completeness, or suitability of any content or products presented. Nothing on this website should be construed as legal, tax, investment, financial, medical, or other professional advice. In addition, no part of this site—including articles or product references—constitutes a solicitation, recommendation, endorsement, advertisement, or offer to buy or sell any securities, franchises, or other financial instruments, particularly in jurisdictions where such activity would be unlawful.
All content is of a general nature and may not address the specific circumstances of any individual or entity. It is not a substitute for professional advice or services. Any actions you take based on the information provided here are strictly at your own risk. You accept full responsibility for any decisions or outcomes arising from your use of this website and agree to release us from any liability in connection with your use of, or reliance upon, the content or products found herein.