
|
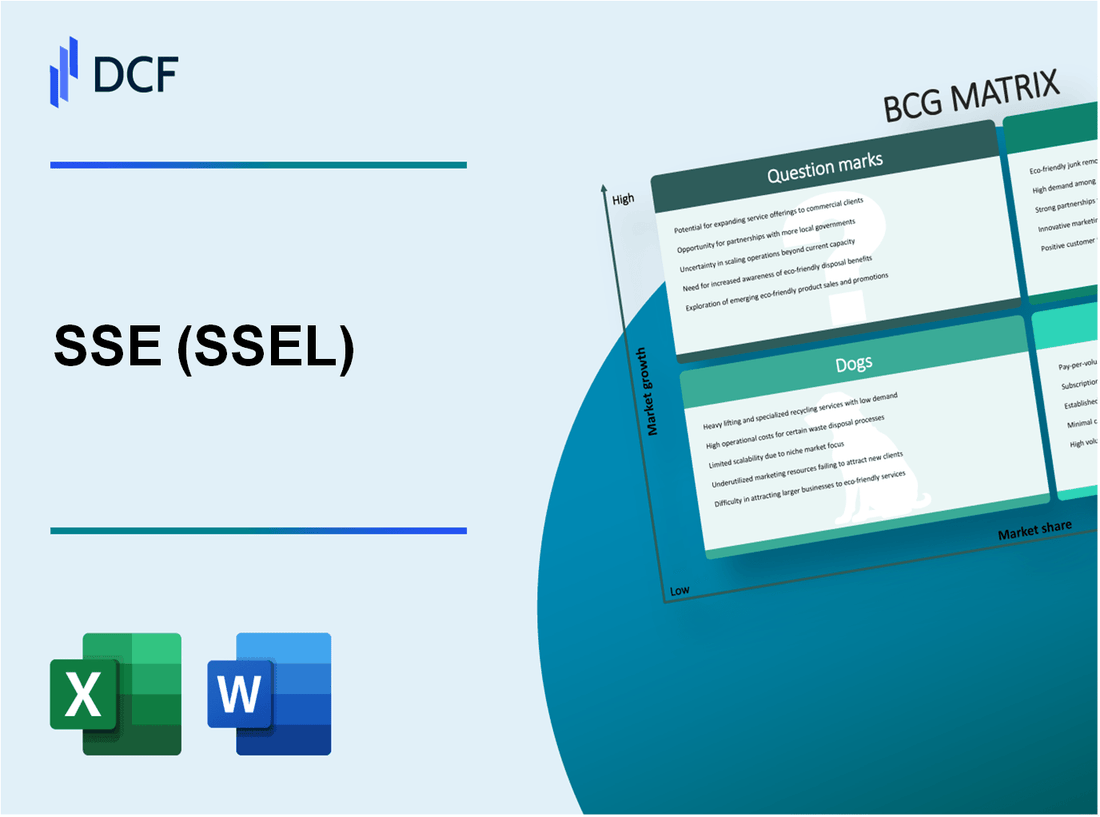
SSE plc (SSE.L): BCG Matrix |
Fully Editable: Tailor To Your Needs In Excel Or Sheets
Professional Design: Trusted, Industry-Standard Templates
Investor-Approved Valuation Models
MAC/PC Compatible, Fully Unlocked
No Expertise Is Needed; Easy To Follow
SSE plc (SSE.L) Bundle
In the dynamic landscape of energy, understanding where a company stands is crucial for investors and analysts alike. SSE plc, a key player in the sector, can be mapped onto the Boston Consulting Group Matrix to reveal its strategic positioning. From thriving renewable energy projects to underperforming fossil fuel assets, each category—Stars, Cash Cows, Dogs, and Question Marks—provides insight into SSE's potential for growth and profitability. Dive in to explore how these segments define the future of this energy giant!
Background of SSE plc
SSE plc, one of the largest energy companies in the UK, has a strong heritage stretching back over 20 years. Established in 1998 through the merger of Southern Electric and Scottish Hydro-Electric, SSE has focused on providing low-carbon, reliable energy solutions to its customers. Headquartered in Perth, Scotland, SSE operates in both electricity generation and distribution, as well as gas transmission.
As of the financial year ending March 2023, SSE reported revenues of approximately £9.2 billion, showcasing a growth trajectory driven by increased investment in renewable energy projects. The company's operations span across several segments, including renewable energy generation, electricity networks, and gas production, with a particular emphasis on sustainable practices and reducing carbon emissions.
SSE has established itself as a leader in the UK's transition to green energy, with a significant portfolio of wind, hydro, and solar power assets. By 2023, SSE's renewable energy capacity had reached over 4.5 GW, with plans to further boost this figure in the coming years, aligning with the UK government’s Net Zero targets.
In terms of market performance, SSE's shares have shown resilience, with a share price increase of approximately 15% over the past year. This performance reflects investor confidence in the company's strategic direction towards sustainable energy solutions. The company remains listed on the London Stock Exchange under the ticker SSE and is part of the FTSE 100 Index.
Moreover, SSE has made considerable strides in enhancing its customer service through the development of innovative energy solutions. The company's commitment to community engagement and sustainability initiatives, such as the SSE Community Fund, further solidifies its reputation in the energy sector.
As SSE plc continues to evolve, it remains focused on its core strategy of delivering sustainable energy while navigating the challenges of a dynamic market landscape. The company's proactive approach to meeting consumer demands and regulatory pressures positions it strongly within the energy industry.
SSE plc - BCG Matrix: Stars
SSE plc has positioned a significant portion of its business as 'Stars' in the BCG Matrix, particularly in the renewable energy sector. These business units demonstrate high market share in a rapidly growing market, contributing substantially to the company’s overall profitability and strategic objectives.
Renewable Energy Projects with High Market Share
SSE’s renewable energy projects have become a cornerstone of its growth strategy. As of 2023, SSE is the UK’s largest generator of renewable energy, producing approximately 7.5 TWh of electricity from renewable sources in the fiscal year 2022/2023, accounting for around 37% of its total output.
Onshore and Offshore Wind Farms
The company operates a robust portfolio of wind farms that significantly contribute to its revenue streams. SSE's onshore wind generation capacity stood at around 3.8 GW as of March 2023, with plans to increase this by an additional 1.6 GW by 2026. Meanwhile, its offshore wind capacity is also substantial, boasting approximately 4.5 GW, with projects like the Dogger Bank Wind Farm expected to be one of the largest offshore wind farms globally, once completed.
| Type of Wind Farm | Current Capacity (GW) | Projected Growth (GW) | Completion Year |
|---|---|---|---|
| Onshore Wind | 3.8 | 1.6 | 2026 |
| Offshore Wind | 4.5 | 5.0 | 2027 |
Innovative Clean Energy Technologies
SSE is also investing heavily in innovative clean energy technologies, such as hydrogen production and battery storage solutions, which are gaining traction in the industry. In 2022, SSE announced plans to invest over £24 billion in renewable energy and low-carbon technologies by 2026, signifying its commitment to becoming a leader in this sector.
Strategic Partnerships in Green Energy
Strategic partnerships further enhance SSE's positioning as a Star within the BCG Matrix. Collaborations with companies like Equinor in offshore wind projects have enabled SSE to leverage additional expertise and resources, aimed at increasing operational capacity and efficiency. The two companies have plans to develop renewable energy projects exceeding 5 GW in capacity by 2027.
In conclusion, SSE plc's focus on renewable energy projects, particularly in onshore and offshore wind farms, innovative technologies, and strategic partnerships positions it firmly as a leader in the energy sector while fulfilling the criteria set forth for 'Stars' in the BCG Matrix.
SSE plc - BCG Matrix: Cash Cows
Within SSE plc, several segments qualify as Cash Cows, characterized by a strong market share in mature markets, generating significant cash flow with minimal growth. These segments are crucial in supporting the company’s overall financial health.
Established Gas and Electricity Supply Networks
SSE operates a substantial gas and electricity supply network, which has reached a maturity level that ensures high market share. As of the fiscal year ending March 2023, SSE reported a customer base of approximately 4.5 million accounts. The segment earned revenues of around £11.8 billion from its retail operations, with a profit margin exceeding 5%.
Long-Term Energy Contracts and Agreements
SSE has secured numerous long-term contracts, which are critical for predictable revenue streams. For instance, SSE signed contracts worth over £1.5 billion in the past year, providing stability and cash flow certainty. These agreements typically span a duration of 10 to 15 years, thereby ensuring income continuity. The average return on these contracts has been around 6.7%.
Mature Hydropower Facilities
The hydropower segment of SSE has been a consistent performer. SSE generates over 8,000 GWh from its hydropower facilities annually, contributing significantly to its revenue. In the fiscal year 2023, SSE's hydropower operations accounted for revenue of approximately £300 million, with a profit margin reaching about 30%. These facilities require minimal maintenance investments compared to their cash generation capabilities.
Energy Distribution Services
SSE’s energy distribution services are another significant cash-generating segment. As of the latest reporting period, SSE managed over 1.2 million kilometers of electricity distribution network, covering a major part of the UK. The distribution network generated revenues of approximately £2.5 billion in the last financial year, with an operating profit margin of around 20%. Investments in infrastructure have increased operational efficiency, further amplifying cash flows.
| Segment | Revenue (£ Billion) | Profit Margin (%) | Key Data |
|---|---|---|---|
| Gas and Electricity Supply | 11.8 | 5 | Customer Base: 4.5 million accounts |
| Long-Term Energy Contracts | 1.5 | 6.7 | Contracts duration: 10-15 years |
| Hydropower Facilities | 0.3 | 30 | Annual Generation: 8,000 GWh |
| Energy Distribution Services | 2.5 | 20 | Network Length: 1.2 million km |
These Cash Cow segments of SSE plc are vital for financing growth opportunities within the organization, maintaining the company’s competitive edge, and supporting overall profitability. Their established market positions allow SSE to leverage their strengths, ensuring continued cash flow generation.
SSE plc - BCG Matrix: Dogs
In the context of SSE plc, a prominent player in the energy sector, certain assets are categorized as 'Dogs' within the BCG Matrix, indicating low market share and low growth. These assets are often cash traps, consuming resources without generating adequate returns.
Declining Coal-Based Energy Assets
SSE plc has been strategically shifting focus away from coal-based energy production in response to regulatory pressures and market trends favoring renewable energy. As of fiscal year 2022, SSE's coal-fired power generation accounted for less than 5% of its total output, reflecting a significant decline from approximately 50% in previous decades. Additionally, coal generation capacity has decreased steadily to 1.6 GW from 3.6 GW five years earlier.
Underperforming Energy Retail Outlets
The energy retail segment has faced stiff competition and market saturation. SSE Energy Services reported £1.3 billion in revenue in 2022, a decrease of 10% year-on-year. The customer base has shrunk to 3.5 million from a peak of 4.5 million, demonstrating a 22% decline. Customer acquisition costs continue to rise, further amplifying financial pressures.
Outdated Fossil Fuel Infrastructure
SSE's infrastructure for fossil fuel generation is costly to maintain and increasingly subject to regulatory scrutiny. The operational costs have increased to approximately £800 million in 2022, with maintenance expenses for older plants nearing £200 million annually. As a result, these assets are often non-competitive compared to more modern renewable technology.
Non-Core Business Ventures
SSE has also invested in various non-core business ventures that have failed to deliver expected returns. For instance, investments in electric vehicle charging infrastructure yielded a mere £40 million in revenue in 2022, contributing less than 3% to overall revenues. The company has recognized that these ventures account for a significant portion of overhead without corresponding profit.
| Asset Type | Market Share | Growth Rate | Revenue (2022) | Operational Costs (2022) |
|---|---|---|---|---|
| Coal-Based Energy | 5% | -10% | Not Disclosed | £800 million |
| Energy Retail | 11% | -10% | £1.3 billion | Not Disclosed |
| Fossil Fuel Infrastructure | N/A | N/A | Not Disclosed | £200 million |
| Non-Core Ventures | N/A | N/A | £40 million | Not Disclosed |
These factors illustrate the challenging landscape SSE plc faces with its Dogs within the BCG Matrix. These assets not only occupy capital but also risk diverting focus from more profitable, growth-oriented areas of the business.
SSE plc - BCG Matrix: Question Marks
SSE plc has several segments that qualify as Question Marks within the BCG Matrix, characterized by their potential for growth in expanding markets yet possessing low market shares. These segments require significant investment to improve their market positions.
Emerging Solar Energy Investments
SSE's investments in solar energy have been on the rise, with a significant focus on sustainability and renewable energy sources. The company announced plans to increase its solar capacity from approximately 1.5 GW to 3 GW by **2025**. However, SSE currently holds only a 3% market share in the UK solar market, which is expected to grow at a compound annual growth rate (CAGR) of 20% through **2026**.
Pilot Projects in Energy Storage
The energy storage sector represents a high-growth opportunity for SSE. The company has initiated pilot projects focusing on battery storage technologies, with total investment amounts nearing £50 million in the next two years. Current capacity stands at 100 MWh, aiming to expand to 500 MWh by **2024**. SSE’s market penetration is currently low, capturing around 5% of the energy storage market, which is expected to grow by 25% annually until **2028**.
New Electric Vehicle Infrastructure
The electric vehicle (EV) infrastructure is crucial for SSE's growth strategy. The company plans to install 5,000 charging points across the UK by **2025**, with an estimated investment of £300 million. Presently, SSE's market share in this sector is less than 4%, while the EV market is projected to grow at a CAGR of 30% through **2030**.
Experimental Smart Grid Technologies
SSE is also exploring smart grid technologies through various experimental projects aimed at enhancing energy efficiency and management. Current spending on these technologies is around £20 million annually, with a goal to increase this to £70 million by **2026**. Currently, SSE has captured less than 3% of the smart grid market, which itself is projected to grow by 15% annually through **2030**.
| Segment | Current Investment (£ million) | Current Capacity/Market Share | Projected Growth Rate (%) | Projected Capacity by 2025/2026 |
|---|---|---|---|---|
| Solar Energy Investments | £200 | 1.5 GW / 3% | 20% | 3 GW |
| Energy Storage | 50 | 100 MWh / 5% | 25% | 500 MWh |
| EV Infrastructure | 300 | 5,000 charging points / 4% | 30% | 20,000 charging points |
| Smart Grid Technologies | 20 | N/A / 3% | 15% | N/A |
The BCG Matrix for SSE plc reveals a dynamic portfolio, highlighting the strength of renewable energy projects as the company's stars. Meanwhile, its established networks serve as reliable cash cows, generating steady revenue. However, the underperformance of coal-based assets falls into the dogs category, indicating potential areas for divestment. Lastly, the question marks signify promising yet uncertain ventures in solar energy and smart technologies, which could define SSE's future growth trajectory.
[right_small]Disclaimer
All information, articles, and product details provided on this website are for general informational and educational purposes only. We do not claim any ownership over, nor do we intend to infringe upon, any trademarks, copyrights, logos, brand names, or other intellectual property mentioned or depicted on this site. Such intellectual property remains the property of its respective owners, and any references here are made solely for identification or informational purposes, without implying any affiliation, endorsement, or partnership.
We make no representations or warranties, express or implied, regarding the accuracy, completeness, or suitability of any content or products presented. Nothing on this website should be construed as legal, tax, investment, financial, medical, or other professional advice. In addition, no part of this site—including articles or product references—constitutes a solicitation, recommendation, endorsement, advertisement, or offer to buy or sell any securities, franchises, or other financial instruments, particularly in jurisdictions where such activity would be unlawful.
All content is of a general nature and may not address the specific circumstances of any individual or entity. It is not a substitute for professional advice or services. Any actions you take based on the information provided here are strictly at your own risk. You accept full responsibility for any decisions or outcomes arising from your use of this website and agree to release us from any liability in connection with your use of, or reliance upon, the content or products found herein.