
|
System1, Inc. (SST) DCF Valuation |
Fully Editable: Tailor To Your Needs In Excel Or Sheets
Professional Design: Trusted, Industry-Standard Templates
Investor-Approved Valuation Models
MAC/PC Compatible, Fully Unlocked
No Expertise Is Needed; Easy To Follow
System1, Inc. (SST) Bundle
Looking to assess the intrinsic value of System1, Inc.? Our (SST) DCF Calculator offers a blend of real-world data and extensive customization features, allowing you to refine your forecasts and enhance your investment strategies.
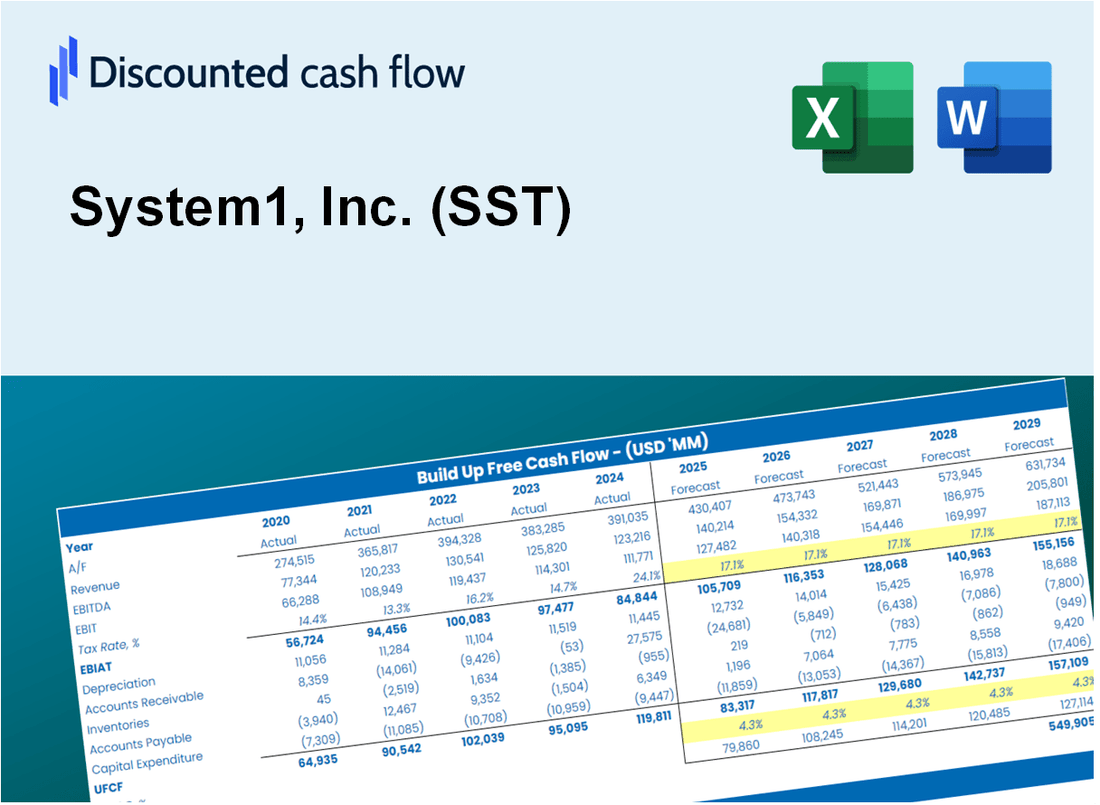
Discounted Cash Flow (DCF) - (USD MM)
| Year | AY1 2020 |
AY2 2021 |
AY3 2022 |
AY4 2023 |
AY5 2024 |
FY1 2025 |
FY2 2026 |
FY3 2027 |
FY4 2028 |
FY5 2029 |
|---|---|---|---|---|---|---|---|---|---|---|
| Revenue | 476.0 | 688.4 | 664.9 | 402.0 | 343.9 | 332.9 | 322.3 | 312.0 | 302.1 | 292.4 |
| Revenue Growth, % | 0 | 44.63 | -3.41 | -39.55 | -14.44 | -3.19 | -3.19 | -3.19 | -3.19 | -3.19 |
| EBITDA | 52.9 | 64.7 | -427.6 | -4.5 | 14.0 | -27.2 | -26.3 | -25.5 | -24.7 | -23.9 |
| EBITDA, % | 11.12 | 9.4 | -64.31 | -1.11 | 4.07 | -8.17 | -8.17 | -8.17 | -8.17 | -8.17 |
| Depreciation | 10.3 | 13.9 | 70.5 | 78.4 | 80.1 | 38.3 | 37.1 | 35.9 | 34.8 | 33.7 |
| Depreciation, % | 2.16 | 2.02 | 10.6 | 19.5 | 23.29 | 11.52 | 11.52 | 11.52 | 11.52 | 11.52 |
| EBIT | 42.6 | 50.8 | -498.1 | -82.9 | -66.1 | -65.5 | -63.4 | -61.4 | -59.5 | -57.6 |
| EBIT, % | 8.95 | 7.38 | -74.91 | -20.62 | -19.22 | -19.68 | -19.68 | -19.68 | -19.68 | -19.68 |
| Total Cash | 29.0 | 47.9 | 8.9 | 135.3 | 63.6 | 44.3 | 42.9 | 41.5 | 40.2 | 38.9 |
| Total Cash, percent | .0 | .0 | .0 | .0 | .0 | .0 | .0 | .0 | .0 | .0 |
| Account Receivables | 71.1 | 90.2 | 80.4 | 56.1 | 62.9 | 48.2 | 46.7 | 45.2 | 43.7 | 42.3 |
| Account Receivables, % | 14.95 | 13.1 | 12.1 | 13.95 | 18.29 | 14.48 | 14.48 | 14.48 | 14.48 | 14.48 |
| Inventories | .0 | -90.2 | 9.1 | .0 | .0 | -7.8 | -7.6 | -7.3 | -7.1 | -6.9 |
| Inventories, % | 0 | -13.1 | 1.36 | 0 | 0 | -2.35 | -2.35 | -2.35 | -2.35 | -2.35 |
| Accounts Payable | 52.1 | 72.8 | 6.7 | 9.5 | 10.4 | 18.6 | 18.0 | 17.4 | 16.9 | 16.3 |
| Accounts Payable, % | 10.95 | 10.58 | 1.01 | 2.36 | 3.02 | 5.58 | 5.58 | 5.58 | 5.58 | 5.58 |
| Capital Expenditure | -6.1 | -6.5 | -10.4 | -8.0 | .0 | -3.9 | -3.7 | -3.6 | -3.5 | -3.4 |
| Capital Expenditure, % | -1.29 | -0.94932 | -1.56 | -1.98 | -0.00901359 | -1.16 | -1.16 | -1.16 | -1.16 | -1.16 |
| Tax Rate, % | 23.54 | 23.54 | 23.54 | 23.54 | 23.54 | 23.54 | 23.54 | 23.54 | 23.54 | 23.54 |
| EBITAT | 148.7 | 49.4 | 31.0 | -143.1 | -50.5 | -49.0 | -47.4 | -45.9 | -44.4 | -43.0 |
| Depreciation | ||||||||||
| Changes in Account Receivables | ||||||||||
| Changes in Inventories | ||||||||||
| Changes in Accounts Payable | ||||||||||
| Capital Expenditure | ||||||||||
| UFCF | 133.9 | 148.6 | -64.6 | -36.4 | 23.6 | 16.2 | -13.3 | -12.9 | -12.5 | -12.1 |
| WACC, % | 10.77 | 10.66 | 6.57 | 10.77 | 9.78 | 9.71 | 9.71 | 9.71 | 9.71 | 9.71 |
| PV UFCF | ||||||||||
| SUM PV UFCF | -22.2 | |||||||||
| Long Term Growth Rate, % | 2.00 | |||||||||
| Free cash flow (T + 1) | -12 | |||||||||
| Terminal Value | -160 | |||||||||
| Present Terminal Value | -101 | |||||||||
| Enterprise Value | -123 | |||||||||
| Net Debt | 211 | |||||||||
| Equity Value | -334 | |||||||||
| Diluted Shares Outstanding, MM | 70 | |||||||||
| Equity Value Per Share | -4.80 |
What You Will Receive
- Pre-Filled Financial Model: System1, Inc.’s (SST) actual data allows for accurate DCF valuation.
- Comprehensive Forecast Control: Modify revenue growth, profit margins, WACC, and other critical factors.
- Real-Time Calculations: Automatic updates provide immediate insights as you adjust parameters.
- Investor-Ready Template: A polished Excel file crafted for high-quality valuation presentations.
- Customizable and Reusable: Designed for adaptability, enabling repeated use for in-depth forecasts.
Key Features
- Pre-Loaded Data: System1’s historical financial statements and pre-filled forecasts.
- Fully Adjustable Inputs: Modify WACC, tax rates, revenue growth, and EBITDA margins.
- Instant Results: View System1’s intrinsic value recalculating in real time.
- Clear Visual Outputs: Dashboard charts illustrate valuation results and key metrics.
- Built for Accuracy: A professional tool designed for analysts, investors, and finance experts.
How It Works
- Step 1: Download the Excel file for System1, Inc. (SST).
- Step 2: Review System1’s pre-filled financial data and projections.
- Step 3: Adjust key inputs such as revenue growth, WACC, and tax rates (highlighted cells).
- Step 4: Observe the DCF model update in real-time as you modify assumptions.
- Step 5: Evaluate the outputs and leverage the results for your investment strategies.
Why Choose This Calculator for System1, Inc. (SST)?
- Designed for Experts: A sophisticated tool favored by analysts, CFOs, and financial consultants.
- Accurate Data: System1's historical and projected financials are preloaded for precision.
- Flexible Scenario Analysis: Easily test various forecasts and assumptions.
- Comprehensive Outputs: Instantly calculates intrinsic value, NPV, and essential metrics.
- User-Friendly: Step-by-step guidance helps you navigate the process effortlessly.
Who Should Use System1, Inc. (SST)?
- Market Analysts: Develop comprehensive models to assess System1's market performance.
- Investment Firms: Evaluate investment opportunities and risks associated with System1 (SST).
- Financial Consultants: Offer clients informed insights on the valuation of System1, Inc. (SST).
- Academic Researchers: Utilize real-time data to study trends in the technology sector.
- Tech Investors: Gain a deeper understanding of how companies like System1 (SST) are valued in the tech landscape.
What the Template Contains
- Historical Data: Includes System1, Inc.'s (SST) past financials and baseline forecasts.
- DCF and Levered DCF Models: Detailed templates to calculate System1, Inc.'s (SST) intrinsic value.
- WACC Sheet: Pre-built calculations for Weighted Average Cost of Capital.
- Editable Inputs: Modify key drivers like growth rates, EBITDA %, and CAPEX assumptions.
- Quarterly and Annual Statements: A complete breakdown of System1, Inc.'s (SST) financials.
- Interactive Dashboard: Visualize valuation results and projections dynamically.
Disclaimer
All information, articles, and product details provided on this website are for general informational and educational purposes only. We do not claim any ownership over, nor do we intend to infringe upon, any trademarks, copyrights, logos, brand names, or other intellectual property mentioned or depicted on this site. Such intellectual property remains the property of its respective owners, and any references here are made solely for identification or informational purposes, without implying any affiliation, endorsement, or partnership.
We make no representations or warranties, express or implied, regarding the accuracy, completeness, or suitability of any content or products presented. Nothing on this website should be construed as legal, tax, investment, financial, medical, or other professional advice. In addition, no part of this site—including articles or product references—constitutes a solicitation, recommendation, endorsement, advertisement, or offer to buy or sell any securities, franchises, or other financial instruments, particularly in jurisdictions where such activity would be unlawful.
All content is of a general nature and may not address the specific circumstances of any individual or entity. It is not a substitute for professional advice or services. Any actions you take based on the information provided here are strictly at your own risk. You accept full responsibility for any decisions or outcomes arising from your use of this website and agree to release us from any liability in connection with your use of, or reliance upon, the content or products found herein.