
|
Sunlands Technology Group (STG) DCF Valuation |
Fully Editable: Tailor To Your Needs In Excel Or Sheets
Professional Design: Trusted, Industry-Standard Templates
Investor-Approved Valuation Models
MAC/PC Compatible, Fully Unlocked
No Expertise Is Needed; Easy To Follow
Sunlands Technology Group (STG) Bundle
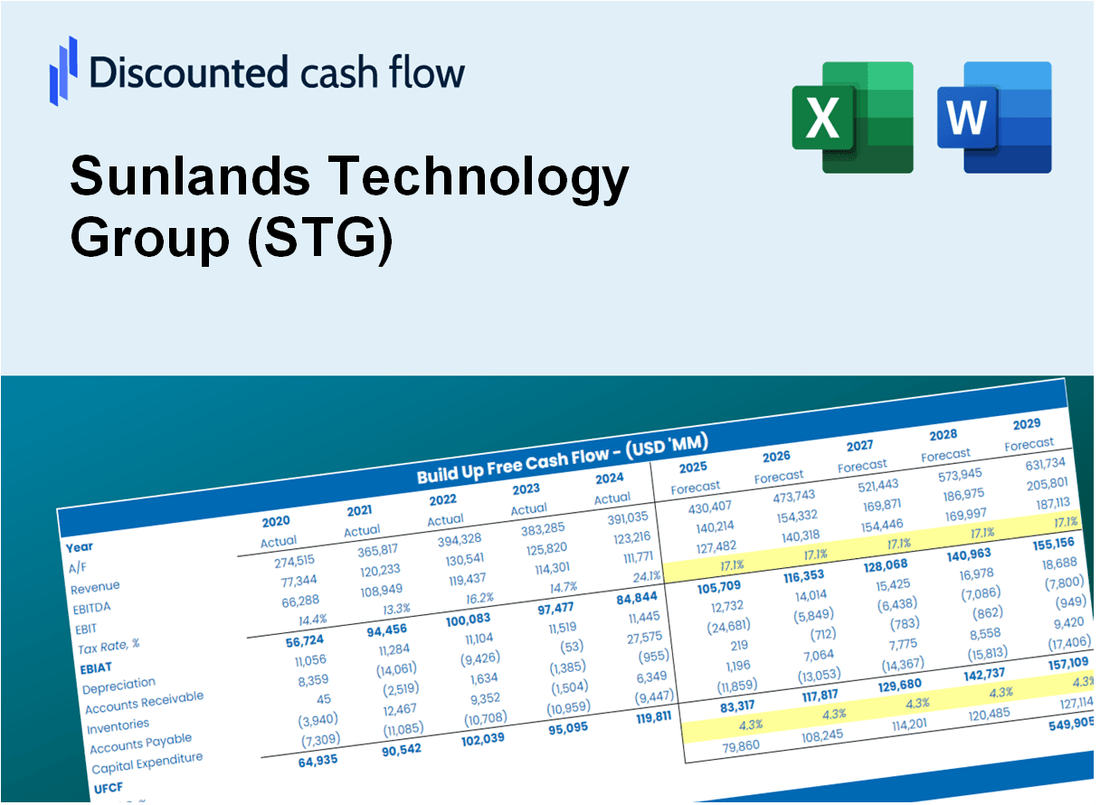
Designed for accuracy, our (STG) DCF Calculator empowers you to evaluate the valuation of Sunlands Technology Group using up-to-date financial data and offers complete flexibility to modify all essential parameters for enhanced projections.
Discounted Cash Flow (DCF) - (USD MM)
| Year | AY1 2020 |
AY2 2021 |
AY3 2022 |
AY4 2023 |
AY5 2024 |
FY1 2025 |
FY2 2026 |
FY3 2027 |
FY4 2028 |
FY5 2029 |
|---|---|---|---|---|---|---|---|---|---|---|
| Revenue | 309.7 | 352.4 | 326.4 | 303.5 | 279.7 | 336.2 | 404.2 | 485.9 | 584.1 | 702.1 |
| Revenue Growth, % | 0 | 13.8 | -7.37 | -7.04 | -7.84 | 20.21 | 20.21 | 20.21 | 20.21 | 20.21 |
| EBITDA | -85.5 | 34.6 | 93.3 | 100.4 | 55.0 | 42.7 | 51.4 | 61.7 | 74.2 | 89.2 |
| EBITDA, % | -27.62 | 9.83 | 28.57 | 33.08 | 19.68 | 12.71 | 12.71 | 12.71 | 12.71 | 12.71 |
| Depreciation | 5.7 | 5.3 | 6.6 | 4.3 | 4.1 | 5.5 | 6.7 | 8.0 | 9.6 | 11.6 |
| Depreciation, % | 1.83 | 1.51 | 2.01 | 1.42 | 1.48 | 1.65 | 1.65 | 1.65 | 1.65 | 1.65 |
| EBIT | -91.2 | 29.3 | 86.7 | 96.1 | 50.9 | 37.2 | 44.7 | 53.7 | 64.6 | 77.6 |
| EBIT, % | -29.45 | 8.32 | 26.56 | 31.66 | 18.2 | 11.06 | 11.06 | 11.06 | 11.06 | 11.06 |
| Total Cash | 179.7 | 113.9 | 115.8 | 127.3 | 110.1 | 139.3 | 167.4 | 201.3 | 242.0 | 290.9 |
| Total Cash, percent | .0 | .0 | .0 | .0 | .0 | .0 | .0 | .0 | .0 | .0 |
| Account Receivables | 3.0 | 7.8 | 3.8 | 4.1 | 3.4 | 4.7 | 5.6 | 6.7 | 8.1 | 9.7 |
| Account Receivables, % | 0.95581 | 2.22 | 1.15 | 1.36 | 1.23 | 1.38 | 1.38 | 1.38 | 1.38 | 1.38 |
| Inventories | 18.6 | 1.2 | 2.0 | 2.0 | 2.8 | 5.8 | 7.0 | 8.4 | 10.1 | 12.1 |
| Inventories, % | 6.01 | 0.35389 | 0.60923 | 0.65939 | 0.98874 | 1.72 | 1.72 | 1.72 | 1.72 | 1.72 |
| Accounts Payable | .0 | .0 | .0 | .0 | .0 | .0 | .0 | .0 | .0 | .0 |
| Accounts Payable, % | 0 | 0 | 0 | 0 | 0 | 0 | 0 | 0 | 0 | 0 |
| Capital Expenditure | -3.8 | -2.3 | -3.1 | -.9 | -.1 | -2.1 | -2.5 | -3.1 | -3.7 | -4.4 |
| Capital Expenditure, % | -1.22 | -0.65938 | -0.95652 | -0.29441 | -0.02039992 | -0.63085 | -0.63085 | -0.63085 | -0.63085 | -0.63085 |
| Tax Rate, % | 0.37859 | 0.37859 | 0.37859 | 0.37859 | 0.37859 | 0.37859 | 0.37859 | 0.37859 | 0.37859 | 0.37859 |
| EBITAT | -91.4 | 33.3 | 85.2 | 92.4 | 50.7 | 36.7 | 44.2 | 53.1 | 63.8 | 76.7 |
| Depreciation | ||||||||||
| Changes in Account Receivables | ||||||||||
| Changes in Inventories | ||||||||||
| Changes in Accounts Payable | ||||||||||
| Capital Expenditure | ||||||||||
| UFCF | -111.1 | 48.8 | 92.0 | 95.5 | 54.7 | 35.9 | 46.2 | 55.5 | 66.7 | 80.2 |
| WACC, % | 7.89 | 7.89 | 7.88 | 7.87 | 7.89 | 7.88 | 7.88 | 7.88 | 7.88 | 7.88 |
| PV UFCF | ||||||||||
| SUM PV UFCF | 221.3 | |||||||||
| Long Term Growth Rate, % | 0.50 | |||||||||
| Free cash flow (T + 1) | 81 | |||||||||
| Terminal Value | 1,092 | |||||||||
| Present Terminal Value | 747 | |||||||||
| Enterprise Value | 968 | |||||||||
| Net Debt | -45 | |||||||||
| Equity Value | 1,013 | |||||||||
| Diluted Shares Outstanding, MM | 27 | |||||||||
| Equity Value Per Share | 37.12 |
What You Will Receive
- Customizable Excel Template: A fully editable Excel-based DCF Calculator featuring pre-filled financial data for Sunlands Technology Group (STG).
- Accurate Data: Historical performance metrics and future projections (highlighted in the yellow cells).
- Flexible Forecasting: Adjust key assumptions such as revenue growth, EBITDA margin, and WACC.
- Instant Calculations: Quickly observe how your inputs affect the valuation of Sunlands Technology Group (STG).
- Professional Resource: Designed for investors, CFOs, consultants, and financial analysts.
- Intuitive Layout: Organized for easy navigation and understanding, complete with step-by-step guidance.
Key Features
- Customizable Forecast Inputs: Adjust essential variables such as student enrollment growth, revenue per student, and operational costs.
- Instant DCF Valuation: Automatically computes intrinsic value, NPV, and other financial metrics in real-time.
- High-Precision Accuracy: Leverages Sunlands Technology Group’s (STG) actual financial data for credible valuation results.
- Streamlined Scenario Analysis: Effortlessly evaluate different scenarios and assess their impacts.
- Efficiency Booster: Remove the complexity of constructing detailed valuation models from the ground up.
How It Works
- Step 1: Download the Excel file.
- Step 2: Review pre-entered Sunlands Technology Group (STG) data (historical and projected).
- Step 3: Adjust key assumptions (yellow cells) based on your analysis.
- Step 4: View automatic recalculations for Sunlands Technology Group’s intrinsic value.
- Step 5: Use the outputs for investment decisions or reporting.
Why Choose Sunlands Technology Group (STG)?
- Save Time: Quickly access our comprehensive platform without the hassle of setup.
- Enhance Accuracy: Utilize our reliable data and insights to minimize valuation errors.
- Fully Customizable: Adjust features to align with your unique business strategies and forecasts.
- Easy to Understand: Intuitive interfaces and visualizations simplify data interpretation.
- Preferred by Professionals: Built for industry experts who prioritize accuracy and efficiency.
Who Should Use This Product?
- Professional Investors: Develop comprehensive and trustworthy valuation models for analyzing portfolios involving Sunlands Technology Group (STG).
- Corporate Finance Teams: Evaluate valuation scenarios to inform internal strategies related to Sunlands Technology Group (STG).
- Consultants and Advisors: Deliver precise valuation insights to clients interested in Sunlands Technology Group (STG).
- Students and Educators: Utilize real-world data to practice and teach financial modeling techniques with a focus on Sunlands Technology Group (STG).
- Tech Enthusiasts: Gain insights into how technology companies like Sunlands Technology Group (STG) are valued in the market.
What the Template Contains
- Operating and Balance Sheet Data: Pre-filled Sunlands Technology Group (STG) historical data and forecasts, including revenue, EBITDA, EBIT, and capital expenditures.
- WACC Calculation: A dedicated sheet for Weighted Average Cost of Capital (WACC), including parameters like Beta, risk-free rate, and share price.
- DCF Valuation (Unlevered and Levered): Editable Discounted Cash Flow models showing intrinsic value with detailed calculations.
- Financial Statements: Pre-loaded financial statements (annual and quarterly) to support analysis.
- Key Ratios: Includes profitability, leverage, and efficiency ratios for Sunlands Technology Group (STG).
- Dashboard and Charts: Visual summary of valuation outputs and assumptions to analyze results easily.
Disclaimer
All information, articles, and product details provided on this website are for general informational and educational purposes only. We do not claim any ownership over, nor do we intend to infringe upon, any trademarks, copyrights, logos, brand names, or other intellectual property mentioned or depicted on this site. Such intellectual property remains the property of its respective owners, and any references here are made solely for identification or informational purposes, without implying any affiliation, endorsement, or partnership.
We make no representations or warranties, express or implied, regarding the accuracy, completeness, or suitability of any content or products presented. Nothing on this website should be construed as legal, tax, investment, financial, medical, or other professional advice. In addition, no part of this site—including articles or product references—constitutes a solicitation, recommendation, endorsement, advertisement, or offer to buy or sell any securities, franchises, or other financial instruments, particularly in jurisdictions where such activity would be unlawful.
All content is of a general nature and may not address the specific circumstances of any individual or entity. It is not a substitute for professional advice or services. Any actions you take based on the information provided here are strictly at your own risk. You accept full responsibility for any decisions or outcomes arising from your use of this website and agree to release us from any liability in connection with your use of, or reliance upon, the content or products found herein.