
|
Neuronetics, Inc. (STIM) DCF Valuation |
Fully Editable: Tailor To Your Needs In Excel Or Sheets
Professional Design: Trusted, Industry-Standard Templates
Investor-Approved Valuation Models
MAC/PC Compatible, Fully Unlocked
No Expertise Is Needed; Easy To Follow
Neuronetics, Inc. (STIM) Bundle
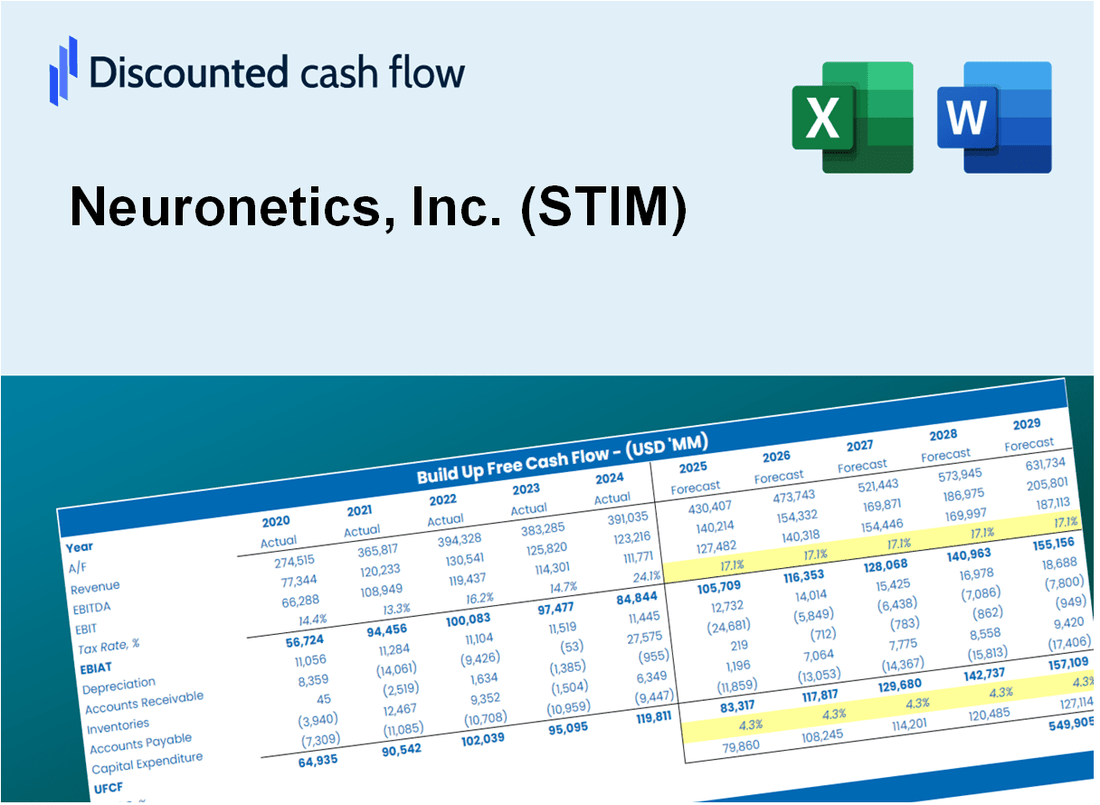
Designed for accuracy, our (STIM) DCF Calculator enables you to evaluate Neuronetics, Inc. valuation using real-world financial data and offers complete flexibility to modify all essential parameters for improved projections.
Discounted Cash Flow (DCF) - (USD MM)
| Year | AY1 2020 |
AY2 2021 |
AY3 2022 |
AY4 2023 |
AY5 2024 |
FY1 2025 |
FY2 2026 |
FY3 2027 |
FY4 2028 |
FY5 2029 |
|---|---|---|---|---|---|---|---|---|---|---|
| Revenue | 49.2 | 55.3 | 65.2 | 71.3 | 74.9 | 83.2 | 92.5 | 102.8 | 114.3 | 127.0 |
| Revenue Growth, % | 0 | 12.32 | 17.89 | 9.42 | 4.96 | 11.15 | 11.15 | 11.15 | 11.15 | 11.15 |
| EBITDA | -21.1 | -26.6 | -31.3 | -22.8 | -34.4 | -36.0 | -40.1 | -44.5 | -49.5 | -55.0 |
| EBITDA, % | -42.78 | -48.01 | -47.94 | -31.9 | -45.89 | -43.3 | -43.3 | -43.3 | -43.3 | -43.3 |
| Depreciation | .9 | 1.1 | 1.6 | 2.0 | 2.1 | 2.0 | 2.2 | 2.5 | 2.7 | 3.0 |
| Depreciation, % | 1.91 | 1.92 | 2.53 | 2.81 | 2.77 | 2.39 | 2.39 | 2.39 | 2.39 | 2.39 |
| EBIT | -22.0 | -27.6 | -32.9 | -24.8 | -36.4 | -38.0 | -42.3 | -47.0 | -52.2 | -58.0 |
| EBIT, % | -44.69 | -49.92 | -50.47 | -34.71 | -48.66 | -45.69 | -45.69 | -45.69 | -45.69 | -45.69 |
| Total Cash | 50.8 | 96.3 | 71.9 | 60.6 | 18.7 | 68.2 | 75.8 | 84.3 | 93.7 | 104.1 |
| Total Cash, percent | .0 | .0 | .0 | .0 | .0 | .0 | .0 | .0 | .0 | .0 |
| Account Receivables | 7.2 | 7.8 | 13.8 | 17.8 | 24.3 | 17.9 | 19.8 | 22.1 | 24.5 | 27.2 |
| Account Receivables, % | 14.55 | 14.07 | 21.2 | 25 | 32.43 | 21.45 | 21.45 | 21.45 | 21.45 | 21.45 |
| Inventories | 3.7 | 6.6 | 8.9 | 8.1 | 4.2 | 8.3 | 9.3 | 10.3 | 11.4 | 12.7 |
| Inventories, % | 7.55 | 11.87 | 13.65 | 11.34 | 5.67 | 10.02 | 10.02 | 10.02 | 10.02 | 10.02 |
| Accounts Payable | 3.7 | 4.3 | 2.4 | 4.8 | 11.1 | 6.8 | 7.5 | 8.3 | 9.3 | 10.3 |
| Accounts Payable, % | 7.61 | 7.77 | 3.73 | 6.66 | 14.79 | 8.11 | 8.11 | 8.11 | 8.11 | 8.11 |
| Capital Expenditure | -.7 | -2.4 | -3.3 | -2.4 | -1.5 | -2.7 | -3.0 | -3.3 | -3.7 | -4.1 |
| Capital Expenditure, % | -1.48 | -4.25 | -5.01 | -3.32 | -1.96 | -3.21 | -3.21 | -3.21 | -3.21 | -3.21 |
| Tax Rate, % | 0.07544409 | 0.07544409 | 0.07544409 | 0.07544409 | 0.07544409 | 0.07544409 | 0.07544409 | 0.07544409 | 0.07544409 | 0.07544409 |
| EBITAT | -25.9 | -31.5 | -34.7 | -24.8 | -36.4 | -38.0 | -42.3 | -47.0 | -52.2 | -58.0 |
| Depreciation | ||||||||||
| Changes in Account Receivables | ||||||||||
| Changes in Inventories | ||||||||||
| Changes in Accounts Payable | ||||||||||
| Capital Expenditure | ||||||||||
| UFCF | -32.8 | -35.7 | -46.6 | -26.0 | -32.1 | -40.7 | -45.2 | -50.2 | -55.8 | -62.1 |
| WACC, % | 9.03 | 9.03 | 9.03 | 9.03 | 9.02 | 9.03 | 9.03 | 9.03 | 9.03 | 9.03 |
| PV UFCF | ||||||||||
| SUM PV UFCF | -193.9 | |||||||||
| Long Term Growth Rate, % | 2.00 | |||||||||
| Free cash flow (T + 1) | -63 | |||||||||
| Terminal Value | -901 | |||||||||
| Present Terminal Value | -585 | |||||||||
| Enterprise Value | -779 | |||||||||
| Net Debt | 64 | |||||||||
| Equity Value | -843 | |||||||||
| Diluted Shares Outstanding, MM | 32 | |||||||||
| Equity Value Per Share | -26.56 |
What You Will Get
- Real STIM Financial Data: Pre-filled with Neuronetics’ historical and projected data for precise analysis.
- Fully Editable Template: Modify key inputs like revenue growth, WACC, and EBITDA % with ease.
- Automatic Calculations: See Neuronetics’ intrinsic value update instantly based on your changes.
- Professional Valuation Tool: Designed for investors, analysts, and consultants seeking accurate DCF results.
- User-Friendly Design: Simple structure and clear instructions for all experience levels.
Key Features
- 🔍 Real-Life STIM Financials: Pre-filled historical and projected data for Neuronetics, Inc.
- ✏️ Fully Customizable Inputs: Adjust all critical parameters (yellow cells) like WACC, growth %, and tax rates.
- 📊 Professional DCF Valuation: Built-in formulas calculate Neuronetics’ intrinsic value using the Discounted Cash Flow method.
- ⚡ Instant Results: Visualize Neuronetics’ valuation instantly after making changes.
- Scenario Analysis: Test and compare outcomes for various financial assumptions side-by-side.
How It Works
- Step 1: Download the Excel file for Neuronetics, Inc. (STIM).
- Step 2: Review Neuronetics' pre-filled financial data and forecasts.
- Step 3: Modify critical inputs such as revenue growth, WACC, and tax rates (highlighted cells).
- Step 4: Observe the DCF model update in real-time as you adjust your assumptions.
- Step 5: Analyze the outputs and leverage the results for your investment decisions.
Why Choose Neuronetics, Inc. (STIM)?
- Save Time: Quickly access comprehensive data without the need for extensive research.
- Enhance Accuracy: Utilize validated financial metrics to ensure precise evaluations.
- Fully Customizable: Adjust parameters to align with your specific investment strategies and forecasts.
- Easy to Interpret: Intuitive visualizations and summaries simplify complex information for better decision-making.
- Trusted by Professionals: Developed for investors who demand high-quality insights and functionality.
Who Should Use Neuronetics, Inc. (STIM)?
- Healthcare Professionals: Understand the latest advancements in neuromodulation therapies and their applications.
- Researchers: Integrate cutting-edge technologies into studies focused on mental health treatments.
- Investors: Evaluate market trends and potential returns associated with Neuronetics, Inc. (STIM) stock.
- Clinical Analysts: Enhance your analysis with customizable models specific to neurostimulation devices.
- Entrepreneurs: Discover how innovative companies like Neuronetics, Inc. (STIM) are reshaping the mental health landscape.
What the Template Contains
- Pre-Filled DCF Model: Neuronetics, Inc.’s (STIM) financial data preloaded for immediate use.
- WACC Calculator: Detailed calculations for Weighted Average Cost of Capital.
- Financial Ratios: Evaluate Neuronetics, Inc.’s (STIM) profitability, leverage, and efficiency.
- Editable Inputs: Change assumptions such as growth, margins, and CAPEX to fit your scenarios.
- Financial Statements: Annual and quarterly reports to support detailed analysis.
- Interactive Dashboard: Easily visualize key valuation metrics and results.
Disclaimer
All information, articles, and product details provided on this website are for general informational and educational purposes only. We do not claim any ownership over, nor do we intend to infringe upon, any trademarks, copyrights, logos, brand names, or other intellectual property mentioned or depicted on this site. Such intellectual property remains the property of its respective owners, and any references here are made solely for identification or informational purposes, without implying any affiliation, endorsement, or partnership.
We make no representations or warranties, express or implied, regarding the accuracy, completeness, or suitability of any content or products presented. Nothing on this website should be construed as legal, tax, investment, financial, medical, or other professional advice. In addition, no part of this site—including articles or product references—constitutes a solicitation, recommendation, endorsement, advertisement, or offer to buy or sell any securities, franchises, or other financial instruments, particularly in jurisdictions where such activity would be unlawful.
All content is of a general nature and may not address the specific circumstances of any individual or entity. It is not a substitute for professional advice or services. Any actions you take based on the information provided here are strictly at your own risk. You accept full responsibility for any decisions or outcomes arising from your use of this website and agree to release us from any liability in connection with your use of, or reliance upon, the content or products found herein.