
|
State Street Corporation (STT) DCF Valuation |
Fully Editable: Tailor To Your Needs In Excel Or Sheets
Professional Design: Trusted, Industry-Standard Templates
Investor-Approved Valuation Models
MAC/PC Compatible, Fully Unlocked
No Expertise Is Needed; Easy To Follow
State Street Corporation (STT) Bundle
Simplify State Street Corporation (STT) valuation with this customizable DCF Calculator! Featuring real State Street Corporation (STT) financials and adjustable forecast inputs, you can test scenarios and discover State Street Corporation (STT) fair value in minutes.
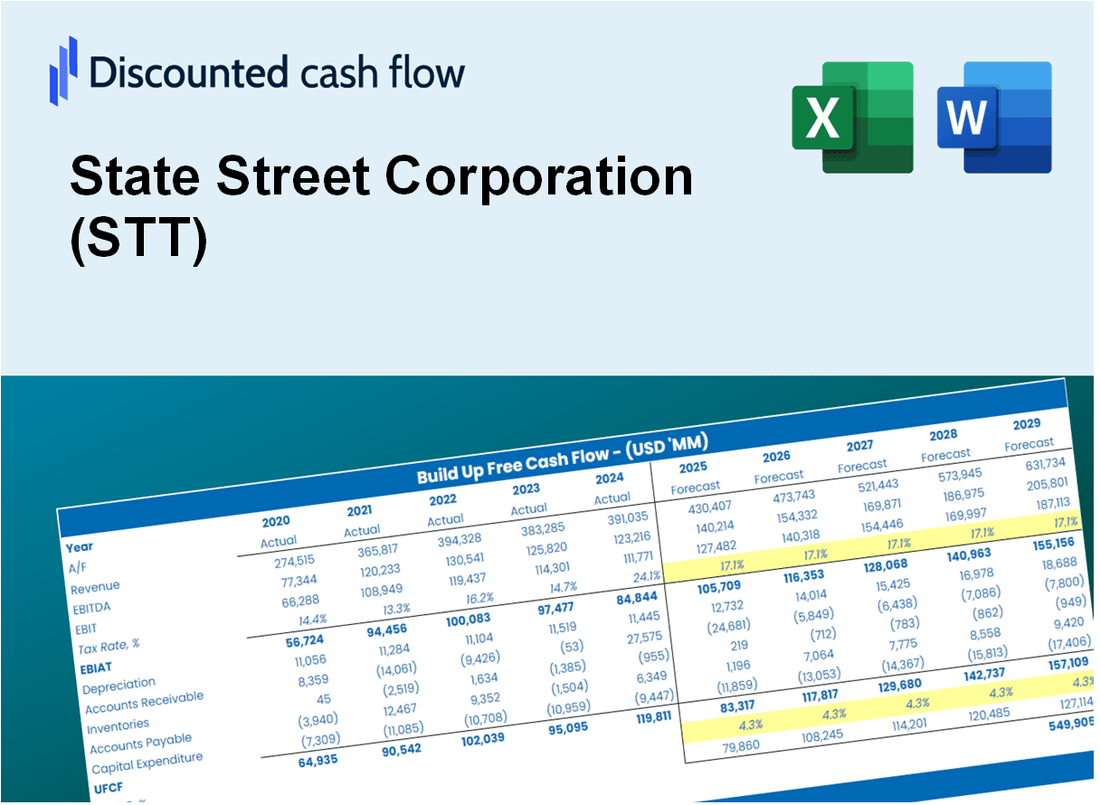
Discounted Cash Flow (DCF) - (USD MM)
| Year | AY1 2020 |
AY2 2021 |
AY3 2022 |
AY4 2023 |
AY5 2024 |
FY1 2025 |
FY2 2026 |
FY3 2027 |
FY4 2028 |
FY5 2029 |
|---|---|---|---|---|---|---|---|---|---|---|
| Revenue | 12,069.0 | 12,030.0 | 13,669.0 | 18,366.0 | 21,973.0 | 25,670.1 | 29,989.3 | 35,035.3 | 40,930.2 | 47,817.0 |
| Revenue Growth, % | 0 | -0.32314 | 13.62 | 34.36 | 19.64 | 16.83 | 16.83 | 16.83 | 16.83 | 16.83 |
| EBITDA | 4,409.0 | 4,728.0 | 4,483.0 | 3,198.0 | 4,000.0 | 7,405.7 | 8,651.7 | 10,107.5 | 11,808.1 | 13,794.9 |
| EBITDA, % | 36.53 | 39.3 | 32.8 | 17.41 | 18.2 | 28.85 | 28.85 | 28.85 | 28.85 | 28.85 |
| Depreciation | 1,510.0 | 1,557.0 | 1,156.0 | 882.0 | 605.0 | 2,128.9 | 2,487.1 | 2,905.6 | 3,394.5 | 3,965.6 |
| Depreciation, % | 12.51 | 12.94 | 8.46 | 4.8 | 2.75 | 8.29 | 8.29 | 8.29 | 8.29 | 8.29 |
| EBIT | 2,899.0 | 3,171.0 | 3,327.0 | 2,316.0 | 3,395.0 | 5,276.8 | 6,164.6 | 7,201.9 | 8,413.6 | 9,829.3 |
| EBIT, % | 24.02 | 26.36 | 24.34 | 12.61 | 15.45 | 20.56 | 20.56 | 20.56 | 20.56 | 20.56 |
| Total Cash | 183,454.0 | 183,450.0 | 146,204.0 | 136,238.0 | 134,550.0 | 25,670.1 | 29,989.3 | 35,035.3 | 40,930.2 | 47,817.0 |
| Total Cash, percent | .0 | .0 | .0 | .0 | .0 | .0 | .0 | .0 | .0 | .0 |
| Account Receivables | 3,968.0 | 4,044.0 | 4,456.0 | 5,745.0 | 4,739.0 | 7,800.7 | 9,113.2 | 10,646.6 | 12,437.9 | 14,530.7 |
| Account Receivables, % | 32.88 | 33.62 | 32.6 | 31.28 | 21.57 | 30.39 | 30.39 | 30.39 | 30.39 | 30.39 |
| Inventories | .0 | .0 | .0 | .0 | .0 | .0 | .0 | .0 | .0 | .0 |
| Inventories, % | 0 | 0 | 0 | 0 | 0 | 0 | 0 | 0 | 0 | 0 |
| Accounts Payable | .0 | .0 | .0 | .0 | .0 | .0 | .0 | .0 | .0 | .0 |
| Accounts Payable, % | 0 | 0 | 0 | 0 | 0 | 0 | 0 | 0 | 0 | 0 |
| Capital Expenditure | -560.0 | -811.0 | -734.0 | -816.0 | -926.0 | -1,304.5 | -1,524.0 | -1,780.4 | -2,080.0 | -2,429.9 |
| Capital Expenditure, % | -4.64 | -6.74 | -5.37 | -4.44 | -4.21 | -5.08 | -5.08 | -5.08 | -5.08 | -5.08 |
| Tax Rate, % | 20.85 | 20.85 | 20.85 | 20.85 | 20.85 | 20.85 | 20.85 | 20.85 | 20.85 | 20.85 |
| EBITAT | 2,420.0 | 2,693.0 | 2,774.0 | 1,944.0 | 2,687.0 | 4,378.3 | 5,115.0 | 5,975.6 | 6,981.0 | 8,155.7 |
| Depreciation | ||||||||||
| Changes in Account Receivables | ||||||||||
| Changes in Inventories | ||||||||||
| Changes in Accounts Payable | ||||||||||
| Capital Expenditure | ||||||||||
| UFCF | -598.0 | 3,363.0 | 2,784.0 | 721.0 | 3,372.0 | 2,141.0 | 4,765.6 | 5,567.4 | 6,504.2 | 7,598.6 |
| WACC, % | 15.68 | 15.86 | 15.67 | 15.74 | 15.14 | 15.62 | 15.62 | 15.62 | 15.62 | 15.62 |
| PV UFCF | ||||||||||
| SUM PV UFCF | 16,338.0 | |||||||||
| Long Term Growth Rate, % | 2.00 | |||||||||
| Free cash flow (T + 1) | 7,751 | |||||||||
| Terminal Value | 56,923 | |||||||||
| Present Terminal Value | 27,555 | |||||||||
| Enterprise Value | 43,893 | |||||||||
| Net Debt | -79,309 | |||||||||
| Equity Value | 123,202 | |||||||||
| Diluted Shares Outstanding, MM | 302 | |||||||||
| Equity Value Per Share | 407.65 |
What You Will Get
- Real STT Financials: Access to historical and projected data for precise valuation.
- Customizable Inputs: Adjust WACC, tax rates, revenue growth, and capital expenditures as needed.
- Dynamic Calculations: Intrinsic value and NPV are computed in real-time.
- Scenario Analysis: Explore various scenarios to assess State Street Corporation’s future performance.
- User-Friendly Design: Designed for professionals while remaining approachable for newcomers.
Key Features
- Comprehensive STT Data: Pre-loaded with State Street Corporation’s historical financials and future projections.
- Flexible Input Options: Modify revenue growth rates, profit margins, WACC, tax rates, and capital expenditures as needed.
- Adaptive Valuation Framework: Instant updates to Net Present Value (NPV) and intrinsic value based on your customized inputs.
- Scenario Analysis: Develop various forecast scenarios to explore different valuation results.
- Intuitive User Interface: Designed to be straightforward and accessible for both professionals and newcomers.
How It Works
- Download the Template: Get instant access to the Excel-based STT DCF Calculator.
- Input Your Assumptions: Adjust yellow-highlighted cells for growth rates, WACC, margins, and more.
- Instant Calculations: The model automatically updates State Street Corporation’s intrinsic value.
- Test Scenarios: Simulate different assumptions to evaluate potential valuation changes.
- Analyze and Decide: Use the results to guide your investment or financial analysis.
Why Choose This Calculator for State Street Corporation (STT)?
- User-Friendly Interface: Perfect for both novices and seasoned professionals.
- Customizable Inputs: Adjust parameters easily to suit your financial analysis.
- Real-Time Feedback: Watch immediate updates to State Street's valuation as you change inputs.
- Preloaded Data: Comes with State Street’s actual financial metrics for swift evaluations.
- Relied Upon by Experts: A go-to tool for investors and analysts making strategic choices.
Who Should Use State Street Corporation (STT)?
- Investors: Leverage our expertise to make informed investment decisions with confidence.
- Financial Analysts: Access comprehensive data and analytics to enhance your financial models.
- Consultants: Utilize our resources to create tailored solutions for your clients’ needs.
- Finance Enthusiasts: Explore in-depth market insights and trends to broaden your financial knowledge.
- Educators and Students: Incorporate our tools and resources into your finance curriculum for practical learning.
What the Template Contains
- Operating and Balance Sheet Data: Pre-filled State Street Corporation (STT) historical data and forecasts, including revenue, EBITDA, EBIT, and capital expenditures.
- WACC Calculation: A dedicated sheet for Weighted Average Cost of Capital (WACC), featuring parameters like Beta, risk-free rate, and share price.
- DCF Valuation (Unlevered and Levered): Editable Discounted Cash Flow models illustrating intrinsic value with comprehensive calculations.
- Financial Statements: Pre-loaded financial statements (annual and quarterly) to facilitate analysis.
- Key Ratios: Includes profitability, leverage, and efficiency ratios for State Street Corporation (STT).
- Dashboard and Charts: Visual summary of valuation outputs and assumptions to simplify results analysis.
Disclaimer
All information, articles, and product details provided on this website are for general informational and educational purposes only. We do not claim any ownership over, nor do we intend to infringe upon, any trademarks, copyrights, logos, brand names, or other intellectual property mentioned or depicted on this site. Such intellectual property remains the property of its respective owners, and any references here are made solely for identification or informational purposes, without implying any affiliation, endorsement, or partnership.
We make no representations or warranties, express or implied, regarding the accuracy, completeness, or suitability of any content or products presented. Nothing on this website should be construed as legal, tax, investment, financial, medical, or other professional advice. In addition, no part of this site—including articles or product references—constitutes a solicitation, recommendation, endorsement, advertisement, or offer to buy or sell any securities, franchises, or other financial instruments, particularly in jurisdictions where such activity would be unlawful.
All content is of a general nature and may not address the specific circumstances of any individual or entity. It is not a substitute for professional advice or services. Any actions you take based on the information provided here are strictly at your own risk. You accept full responsibility for any decisions or outcomes arising from your use of this website and agree to release us from any liability in connection with your use of, or reliance upon, the content or products found herein.