|
Seagate Technology Holdings plc (STX) DCF Valuation |
Fully Editable: Tailor To Your Needs In Excel Or Sheets
Professional Design: Trusted, Industry-Standard Templates
Investor-Approved Valuation Models
MAC/PC Compatible, Fully Unlocked
No Expertise Is Needed; Easy To Follow
Seagate Technology Holdings plc (STX) Bundle
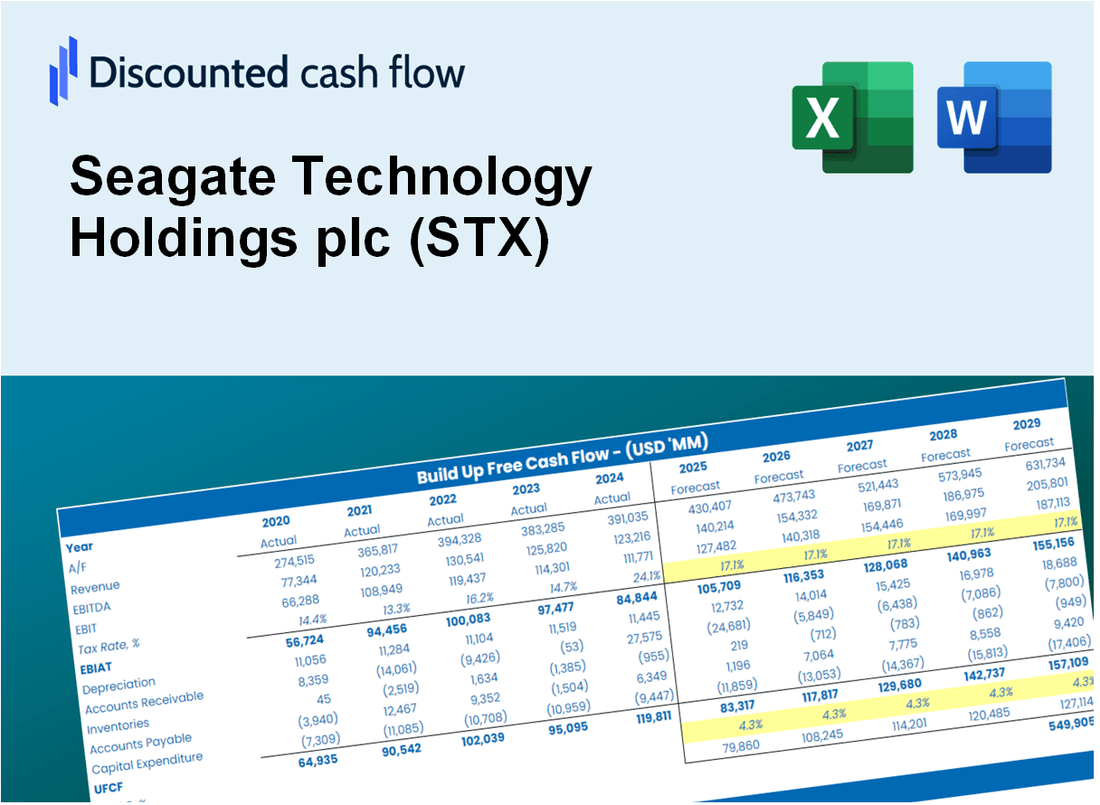
Gain insights into your Seagate Technology Holdings plc (STX) valuation analysis using our cutting-edge DCF Calculator! Preloaded with real (STX) data, this Excel template empowers you to adjust forecasts and assumptions to accurately determine Seagate Technology's intrinsic value.
What You Will Receive
- Genuine STX Financial Data: Pre-loaded with Seagate’s historical and projected figures for accurate analysis.
- Completely Customizable Template: Easily adjust key inputs like revenue growth, WACC, and EBITDA %.
- Instant Calculations: Witness Seagate’s intrinsic value update immediately based on your modifications.
- Professional Valuation Tool: Tailored for investors, analysts, and consultants aiming for precise DCF outcomes.
- User-Friendly Interface: Intuitive layout and straightforward instructions suitable for all skill levels.
Key Features
- Pre-Loaded Data: Seagate’s historical financial statements and pre-filled forecasts.
- Fully Adjustable Inputs: Modify WACC, tax rates, revenue growth, and EBITDA margins.
- Instant Results: View Seagate’s intrinsic value recalculating in real time.
- Clear Visual Outputs: Dashboard charts present valuation results and key metrics.
- Built for Accuracy: A professional tool designed for analysts, investors, and finance experts.
How It Works
- Download: Obtain the pre-built Excel file containing Seagate Technology's (STX) financial data.
- Customize: Modify projections such as revenue growth, EBITDA %, and WACC to fit your analysis.
- Update Automatically: Watch as intrinsic value and NPV calculations refresh in real-time.
- Test Scenarios: Generate various forecasts and evaluate results side by side.
- Make Decisions: Leverage the valuation insights to inform your investment choices.
Why Choose This Calculator for Seagate Technology Holdings plc (STX)?
- Comprehensive Tool: Integrates DCF, WACC, and financial ratio analyses tailored for Seagate.
- Customizable Inputs: Modify yellow-highlighted cells to explore different financial scenarios for (STX).
- Detailed Insights: Automatically computes Seagate’s intrinsic value and Net Present Value.
- Preloaded Data: Historical and forecasted data provide reliable starting points for analysis.
- Professional Quality: Perfect for financial analysts, investors, and business consultants focusing on (STX).
Who Should Use This Product?
- Investors: Accurately assess Seagate Technology's (STX) fair value before making investment choices.
- CFOs: Utilize a professional-grade DCF model for financial reporting and analysis related to Seagate Technology (STX).
- Consultants: Easily customize the template for valuation reports tailored to Seagate Technology (STX) clients.
- Entrepreneurs: Obtain insights into financial modeling practices employed by industry leaders like Seagate Technology (STX).
- Educators: Implement it as a teaching resource to illustrate valuation techniques relevant to Seagate Technology (STX).
What the Template Contains
- Pre-Filled DCF Model: Seagate Technology's financial data preloaded for immediate use.
- WACC Calculator: Detailed calculations for Weighted Average Cost of Capital.
- Financial Ratios: Evaluate Seagate's profitability, leverage, and efficiency.
- Editable Inputs: Change assumptions such as growth, margins, and CAPEX to fit your scenarios.
- Financial Statements: Annual and quarterly reports to support detailed analysis.
- Interactive Dashboard: Easily visualize key valuation metrics and results.
Disclaimer
All information, articles, and product details provided on this website are for general informational and educational purposes only. We do not claim any ownership over, nor do we intend to infringe upon, any trademarks, copyrights, logos, brand names, or other intellectual property mentioned or depicted on this site. Such intellectual property remains the property of its respective owners, and any references here are made solely for identification or informational purposes, without implying any affiliation, endorsement, or partnership.
We make no representations or warranties, express or implied, regarding the accuracy, completeness, or suitability of any content or products presented. Nothing on this website should be construed as legal, tax, investment, financial, medical, or other professional advice. In addition, no part of this site—including articles or product references—constitutes a solicitation, recommendation, endorsement, advertisement, or offer to buy or sell any securities, franchises, or other financial instruments, particularly in jurisdictions where such activity would be unlawful.
All content is of a general nature and may not address the specific circumstances of any individual or entity. It is not a substitute for professional advice or services. Any actions you take based on the information provided here are strictly at your own risk. You accept full responsibility for any decisions or outcomes arising from your use of this website and agree to release us from any liability in connection with your use of, or reliance upon, the content or products found herein.