
|
Suncor Energy Inc. (SU): 5 FORCES Analysis [Nov-2025 Updated] |
Fully Editable: Tailor To Your Needs In Excel Or Sheets
Professional Design: Trusted, Industry-Standard Templates
Investor-Approved Valuation Models
MAC/PC Compatible, Fully Unlocked
No Expertise Is Needed; Easy To Follow
Suncor Energy Inc. (SU) Bundle
You're looking at one of North America's biggest energy plays, Suncor Energy Inc. (SU), and wondering how it truly stacks up against the market pressures of late 2025, especially with the energy transition accelerating. Honestly, this integrated giant-whose core strength is its massive, long-life oil sands reserves and which is targeting Oil Sands cash operating costs between C$26.00 and C$29.00 per barrel for 2025-is sitting right at the crossroads of legacy production and future uncertainty. To really map out the risks and opportunities you need to consider for your portfolio, we have to dissect the core competitive structure using Michael Porter's framework. Below, I've broken down the bargaining power of suppliers and customers, the rivalry intensity, and the threats from substitutes and new entrants, giving you the precise, analyst-grade view you need to make your next move.
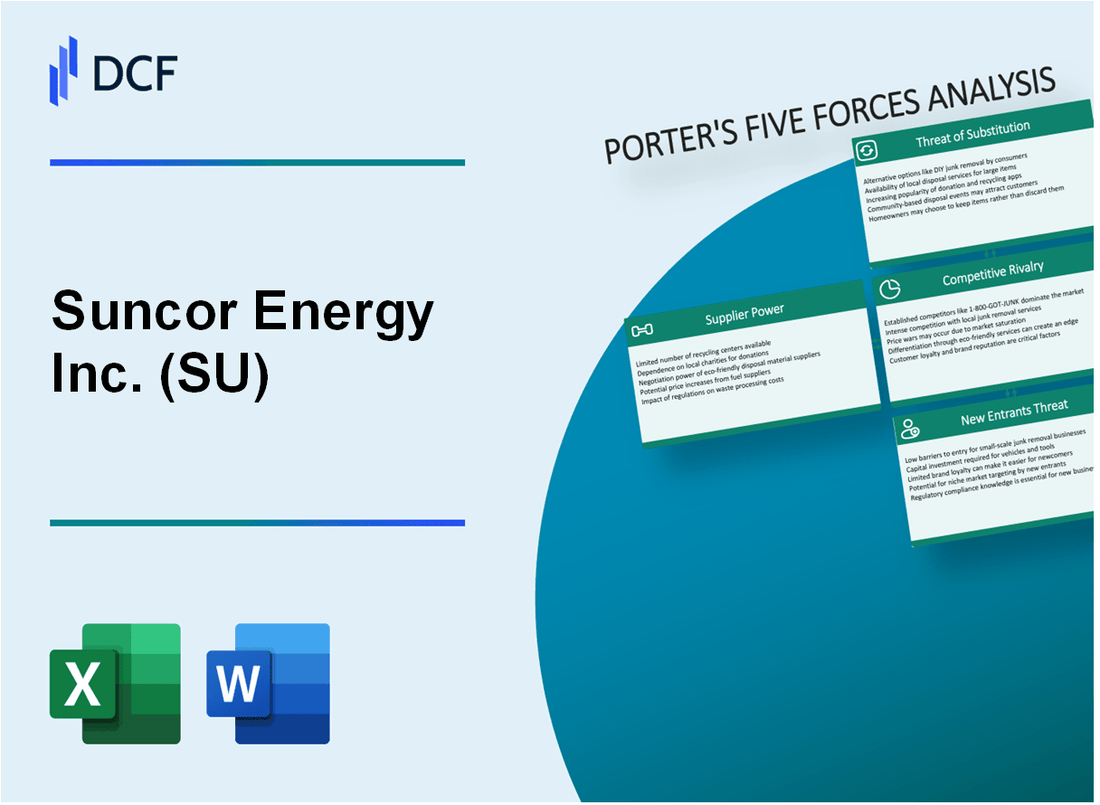
Suncor Energy Inc. (SU) - Porter's Five Forces: Bargaining power of suppliers
You're looking at Suncor Energy Inc.'s supplier landscape as of late 2025, and the power dynamic here is a mix of Suncor's massive scale pushing back against specialized needs. Honestly, the biggest lever suppliers have is often tied to commodity price swings, which directly hit your bottom line.
Input costs are definitely volatile, and you see that reflected in the assumptions Suncor uses for its operational planning. For instance, the 2025 corporate guidance was built assuming the natural gas used at each respective asset would be priced at an average of $2.50/GJ for the year. This specific assumption shows how critical energy input pricing is to their cost structure.
Suncor's sheer size does give it significant leverage when procuring high-volume, standardized items, like some specialized mining equipment and services. When you're operating at the scale Suncor is-reporting record upstream production of 870,000 bbls/d in Q3 2025-your order book carries weight with major vendors.
Still, the power shifts when you get into proprietary areas. High switching costs definitely exist for key suppliers of specialized oil sands technology and the maintenance services required for complex assets like the Base Plant Upgrader 1, which underwent a 91-day outage for coke drum replacement in 2025. Once you integrate a specific technology, getting someone else to service it or replace it can be a real headache, and that translates to supplier leverage.
You can see the material exposure to input costs when you look at the quarterly financials. Operating, selling, and general expenses (OS&G) were reported at $3.270 billion in Q3 2025. The increase from the prior year quarter was partly due to higher commodity input costs, showing that even with scale, those external price movements get passed through.
On the cost control side, Suncor Energy Inc. is targeting its Oil Sands operations cash operating costs to be between C$26.00 and C$29.00 per barrel for 2025. That range is a direct result of managing supplier contracts and internal efficiencies.
Here's a quick look at some of those key cost and expense figures that illustrate supplier impact:
| Metric | Value/Range | Period/Assumption |
|---|---|---|
| Oil Sands Cash Operating Costs Target | C$26.00 - C$29.00 per barrel | 2025 Guidance |
| Natural Gas Input Cost Assumption | $2.50/GJ (average) | 2025 Guidance Assumption |
| Operating, Selling, and General Expenses (OS&G) | $3.270 billion | Q3 2025 |
| Fort Hills Cash Operating Costs Target | C$33.00 - C$36.00 per barrel | 2025 Guidance |
The bargaining power of suppliers is therefore moderated by these factors:
- Supplier leverage on key energy inputs like natural gas.
- Suncor's scale providing procurement advantage in large contracts.
- High costs associated with switching proprietary technology vendors.
- Exposure to input cost inflation reflected in the $3.270 billion OS&G spend.
Finance: draft 13-week cash view by Friday.
Suncor Energy Inc. (SU) - Porter's Five Forces: Bargaining power of customers
You're assessing customer power at Suncor Energy Inc. (SU), and honestly, it lands in a moderate spot. That's largely because of the company's integrated model, stretching from the oil sands upstream right down to the retail pump. This integration gives Suncor some insulation, but customers still hold significant sway in different segments.
For the everyday person filling up, the bargaining power is high because they are extremely price-sensitive. They see the price at the pump and can easily shop around. Suncor's Petro-Canada retail network, which has over 1,800 locations across Canada, is the direct interface here, meaning brand loyalty has to fight against daily price fluctuations. If the price is off by even a few cents, you're definitely going somewhere else.
On the other side, your B2B customers-the big industrial and commercial buyers-have leverage because they buy in massive volumes. They aren't just filling a tank; they are fueling entire fleets or operations, so they negotiate contracts based on significant quantity commitments. Still, Suncor's ability to supply reliably helps temper this power.
The game for crude sales is changing, which shifts power dynamics. The new export capacity from the Trans Mountain pipeline expansion (TME) is key. That project effectively doubled the system's capacity to 890,000 barrels per day, opening direct pathways to Pacific Rim customers, including Chinese refineries. This move diversifies crude sales away from a heavy reliance on a few U.S. Midwest buyers, giving Suncor better negotiation leverage by having more options.
Downstream demand remains robust, which is a strong counterpoint to customer negotiation. Suncor posted record Q3 2025 refined product sales of 646,800 bbls/d, demonstrating that even with price sensitivity, the market is absorbing their refined output at high levels. This strong demand helps Suncor maintain pricing power in its finished goods.
Here's a quick look at the scale of the customer-facing operations:
| Customer Segment | Key Metric | Associated Figure |
|---|---|---|
| B2C Retail (Petro-Canada) | Number of Retail Locations | Over 1,800 |
| Downstream Demand | Record Q3 2025 Refined Product Sales | 646,800 bbls/d |
| Upstream Diversification | TME Capacity Increase | From 300,000 to 890,000 bbls/d |
The integrated structure means that while retail customers are price-sensitive, the overall strength of demand, as shown by those record sales figures, prevents customer power from becoming overwhelming across the entire enterprise. The TME capacity is a strategic lever that helps Suncor push back against traditional buyer concentration.
Suncor Energy Inc. (SU) - Porter's Five Forces: Competitive rivalry
Rivalry is intense among a few large, capital-intensive Canadian oil sands producers like Cenovus Energy and Imperial Oil.
Competitors are aggressively increasing 2025 production targets, reflecting a competitive push for output growth following pipeline capacity additions.
| Producer | 2025 Production Target (Midpoint/Range) | Year-over-Year Growth Rate |
| Suncor Energy Inc. | 810,000 to 840,000 barrels per day (bpd) | Up to 5 percent increase, or 4.4% at the midpoint of the initial guidance range |
| Cenovus Energy Inc. | 805,000 to 845,000 barrels of oil equivalent per day (boed) | Approximately 4 percent increase |
| Imperial Oil Ltd. | 433,000 to 456,000 boed | Approximately 3.1 percent increase |
Exit barriers are extremely high due to the long-life, fixed nature of oil sands assets. Suncor Energy Inc. possesses approximately 7 billion barrels of 2P reserves and maintains a corporate decline rate of just ~5 percent.
Suncor Energy Inc. maintains a cost advantage, having reduced its corporate WTI breakeven by US$10 per barrel versus 2023 levels.
High asset utilization is a key competitive differentiator for Suncor Energy Inc., demonstrating operational excellence:
- Upgraders utilization reached 102 percent in the third quarter of 2025.
- Refineries utilization reached 106 percent in the third quarter of 2025.
- Year-to-date refinery utilization was at 101 percent.
Suncor Energy Inc. (SU) - Porter's Five Forces: Threat of substitutes
The long-term threat from electric vehicles (EVs) and renewable energy is definitely real, particularly when you look at the refined products segment of Suncor Energy Inc.'s business. You see this pressure reflected in national policy, for instance, with the federal government setting a target for 100% zero-emission light-duty vehicle sales by 2035, and the Electric Vehicle Availability Standard applying to those sales starting in 2026.
Still, the near-term substitution threat remains manageable because global oil demand projections, despite the transition, still show growth through 2050. For context on current market pricing that Suncor faces, the U.S. Energy Information Administration projects Brent crude to average around US$74 per barrel for 2025, before potentially easing to US$66 in 2026.
Suncor Energy Inc. is taking defensive action by investing in EV charging infrastructure through its Petro-Canada retail sites, aiming to stay relevant in the evolving transportation fuel landscape. This effort is part of their 'Electric Highway' initiative. Here's a quick look at the initial build-out:
| Metric | Value | Year/Status |
|---|---|---|
| Initial EV Charging Stations Built | 50 | 2019 |
| Additional EV Charging Sites Added | 10 | 2020 |
| Total Public Charging Ports in Canada (as of March 1, 2025) | 33,767 | 2025 |
| Projected ZEV Light-Duty Vehicles on Road (by 2030) | 5 million | 2030 |
The company strategically pivoted away from direct ownership of distributed renewables, selling its portfolio to focus capital on core operations and lower-carbon fuels that complement its existing assets. Suncor divested its wind and solar assets to Canadian Utilities Limited for C$730 million in 2022. This move streamlined the portfolio to concentrate efforts on areas like hydrogen and renewable fuels.
The strategic rationale for the sale involved focusing on areas complementary to the base business, such as:
- Developing oilsands, refining, hydrogen, and renewable fuel projects.
- Accelerating commercial-scale deployment of carbon capture technology.
- Replacing coke-fired boilers at Base Plant with lower emission cogeneration units.
For other major product lines, the threat of substitution remains low in the current market environment. Specifically, substitution pressures for industrial feedstocks and jet fuel are not yet material enough to significantly alter Suncor Energy Inc.'s operational focus or near-term revenue streams.
Suncor Energy Inc. (SU) - Porter's Five Forces: Threat of new entrants
You're looking at the barriers to entry for a new player trying to break into the Canadian oil sands space against Suncor Energy Inc. Honestly, the deck is stacked heavily against them.
Capital requirements are a massive barrier; Suncor's 2025 capital expenditure is an estimated C$5.7 billion to C$5.9 billion. That figure, updated in August 2025, shows the sheer scale of ongoing investment just to sustain and optimize existing operations. For a new entrant, securing financing for a grassroots oil sands project, which requires capital expenditure over multiple years before seeing a return, is an almost insurmountable hurdle.
Significant economies of scale are required for oil sands extraction and upgrading to be profitable. The challenge that oil sands producers face has always been the large up-front, out-of-pocket expenditure over multiple years required to bring new projects online. Building a new oilsands facility would require a massive investment to the tune of billions of dollars. To put that in perspective, the last major oilsands facility to open was Suncor's Fort Hills mine, which started in 2018.
Here's a quick look at the scale of investment Suncor is making just to maintain its position, which a new entrant would need to match or exceed:
| Metric | Value/Range (2025 Guidance) | Context |
|---|---|---|
| Suncor 2025 Estimated Capital Spend | C$5.7 billion to C$5.9 billion | Updated estimate as of August 2025 |
| Oil Sands Cash Operating Costs Target | C$26.00 to C$29.00 per barrel | Targeted cost for Oil Sands operations |
| Last Major Oilsands Facility Opening | 2018 | Suncor's Fort Hills mine |
| Trans Mountain Expansion Cost Overrun | Six times over budget | Illustrates project execution risk and cost inflation |
Regulatory hurdles, including stringent environmental and emissions policies, create substantial entry friction. The current federal government is committed to policies constraining oil production, continuing the path to "net-zero 2050" and retaining Canada's all-EV new car future beginning in 2036. Legislation like Bill C-69, the Canadian Impact Assessment Act, and the carbon cap on oil and gas add significant regulatory risk that deters investment.
Access to existing pipeline infrastructure and refining capacity is tightly controlled by incumbents. The dismal experience with major pipeline projects-Gateway was canceled, Energy East was canceled, and the Trans Mountain expansion ended up being six times over budget-makes new entrants hesitant to commit capital without certainty of market access. Companies won't spend billions if they can't get their product to market at a good price.
Suncor's fully integrated model, from oil sands to retail, is nearly impossible for a new player to replicate. Suncor Energy Inc. is Canada's leading integrated energy company. This means they manage the entire value chain:
- Upstream: Oil sands and offshore oil production.
- Downstream: Petroleum refining in Canada and the U.S..
- Marketing: The Petro-Canada retail and wholesale network.
This integration helps smooth volatile oil price cycles because value is captured at every step. A new entrant would need to build out all three complex, capital-intensive segments simultaneously; that's a defintely tough ask.
Finance: draft 13-week cash view by Friday.
Disclaimer
All information, articles, and product details provided on this website are for general informational and educational purposes only. We do not claim any ownership over, nor do we intend to infringe upon, any trademarks, copyrights, logos, brand names, or other intellectual property mentioned or depicted on this site. Such intellectual property remains the property of its respective owners, and any references here are made solely for identification or informational purposes, without implying any affiliation, endorsement, or partnership.
We make no representations or warranties, express or implied, regarding the accuracy, completeness, or suitability of any content or products presented. Nothing on this website should be construed as legal, tax, investment, financial, medical, or other professional advice. In addition, no part of this site—including articles or product references—constitutes a solicitation, recommendation, endorsement, advertisement, or offer to buy or sell any securities, franchises, or other financial instruments, particularly in jurisdictions where such activity would be unlawful.
All content is of a general nature and may not address the specific circumstances of any individual or entity. It is not a substitute for professional advice or services. Any actions you take based on the information provided here are strictly at your own risk. You accept full responsibility for any decisions or outcomes arising from your use of this website and agree to release us from any liability in connection with your use of, or reliance upon, the content or products found herein.