
|
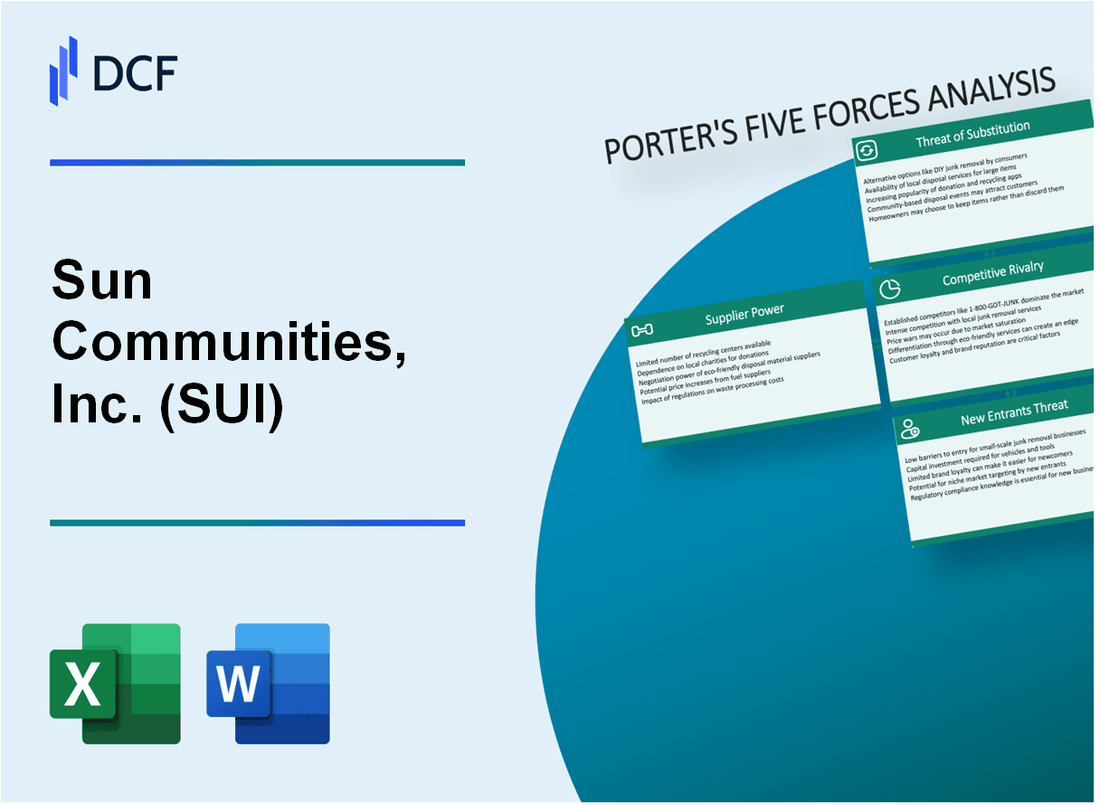
Sun Communities, Inc. (SUI): 5 FORCES Analysis [Nov-2025 Updated] |
Fully Editable: Tailor To Your Needs In Excel Or Sheets
Professional Design: Trusted, Industry-Standard Templates
Investor-Approved Valuation Models
MAC/PC Compatible, Fully Unlocked
No Expertise Is Needed; Easy To Follow
Sun Communities, Inc. (SUI) Bundle
You're looking at the competitive landscape for Sun Communities, Inc. (SUI) as we head into late 2025, and honestly, the picture is strong, thanks to their land-lease model. My take, based on over two decades in this game, is that SUI is successfully navigating industry pressures-from supplier costs to customer choices-because their assets are hard to replicate. Just look at the numbers: they are guiding toward a $6.63 Core FFO per share midpoint for the year, supported by rock-solid operational stats like 98% North America Same Property Occupancy in Q3 and a 10.1% jump in MH Net Operating Income. So, how exactly does this powerhouse maintain its edge against rivals like Equity Lifestyle Properties and fend off new entrants despite high capital barriers? Dive into the five forces breakdown below to see the precise mechanics of their competitive moat.
Sun Communities, Inc. (SUI) - Porter's Five Forces: Bargaining power of suppliers
When you look at Sun Communities, Inc. (SUI)'s supply side, you see a few distinct groups, each with a different level of leverage over the REIT's operations and growth. Honestly, it's a mixed bag, but the real estate component-land-is where the pressure really mounts.
Land Sellers and Development Hurdles
Land sellers hold high power due to scarce zoning and entitlement hurdles. Securing new, desirable land for manufactured housing (MH) or recreational vehicle (RV) communities is tough because local governments often restrict development. This scarcity means when a suitable parcel does come up, the seller knows SUI has limited alternatives. For instance, in the nine months ending September 30, 2025, Sun Communities, Inc. increased its revenue-producing sites by approximately 1,000 MH and annual RV sites, which requires acquiring or developing land, a process constrained by these local powers. You can see SUI is still actively investing, having closed on acquisitions of 14 communities for $457.0 million in October 2025, which underscores the high cost of entry when land is available.
Utility Providers: Pass-Through Power
Utility providers generally have moderate power, but SUI has built in a mechanism to blunt the impact: costs are often passed through to residents. This is a key operational defense. For the 2025 guidance, North America Same Property results show that utility revenue netted against utility expense resulted in a net figure of $94.5 million. Similarly, in the UK, the net utility revenue against expense for 2025 guidance was $19.2 million. While the gross cost from utilities might be rising, the fact that SUI can largely neutralize this on a net basis to the company suggests the power is moderated by contractual or operational pass-through ability.
Manufactured Home Builders: Scale Advantage
Manufactured home builders have low power because Sun Communities, Inc. operates at a massive scale as a large buyer. While the search results don't give us SUI's specific annual spend on new homes, the sheer size of the portfolio-with 98.4% occupancy on MH and annual RV sites as of September 30, 2025-means SUI's purchasing volume is significant enough to command favorable terms from home manufacturers. The company's focus on its core MH/RV business after the Safe Harbor sale further concentrates its buying power in this specific supply chain segment.
Acquisition Targets: Pricing Pressure
Existing community owners, who are essentially suppliers of entire operating assets, demand high prices. This is driven by the low capitalization rates (cap rates) prevalent in the high-quality MH and RV space. When cap rates are low, buyers like SUI must pay higher multiples for the same cash flow. This is evident in SUI's recent activity; they spent $457.0 million to acquire 14 communities in October 2025. This high acquisition spend reflects the competitive pricing environment set by sellers who benefit from low cap rates, which is a direct measure of their pricing power in the M&A market.
Here's a quick look at some of the relevant financial inputs and outputs related to these supplier dynamics as of late 2025:
| Metric Category | Specific Data Point | Value (USD) | Reporting Period/Context |
| Acquisition Investment | Total Cash Consideration for October 2025 Acquisitions | $457.0 million | Q3 2025 Acquisitions |
| Land/Development Investment | Purchase of Land Acquisitions (including capitalized costs) | $24.5 (implied millions) | Full Year 2024/Early 2025 |
| Utility Cost Neutrality (North America) | Net Utility Revenue vs. Expense (Guidance) | $94.5 million | 2025 Guidance |
| Utility Cost Neutrality (UK) | Net Utility Revenue vs. Expense (Guidance) | $19.2 million | 2025 Guidance |
| Available Acquisition Capital | Restricted Cash in 1031 Exchange Escrow Accounts | $629.5 million | As of September 30, 2025 |
The bargaining power of suppliers is heavily weighted by the scarcity of developable land and the high valuation expectations from sellers of existing, high-quality assets. SUI counters this by maintaining near-perfect occupancy, which gives it pricing power on the revenue side, and by leveraging its massive scale against home builders.
You'll want Finance to run a sensitivity analysis on land acquisition costs, assuming a 5% increase in per-acre cost for the next $200 million of planned land buys, just to see the impact on projected 2026 FFO. Finance: draft sensitivity memo by next Tuesday.
Sun Communities, Inc. (SUI) - Porter's Five Forces: Bargaining power of customers
You're analyzing Sun Communities, Inc. (SUI) and the customer power dynamic is clearly segmented based on the property type. For the core Manufactured Housing (MH) residents, the bargaining power is decidedly low. This stems primarily from the high, often prohibitive, switching costs associated with physically relocating a manufactured home. It's not like packing a suitcase; moving a home involves significant logistics, permits, and site fees elsewhere, which keeps residents anchored to their current location.
The operational statistics from the third quarter of 2025 strongly support this low-power dynamic. The North America Same Property Occupancy for MH and annual RV sites stood at 98.4% as of September 30, 2025, up from 97.7% at the same point in 2024. This high retention shows customers are staying put. Furthermore, the strength in the MH segment is evident in its performance, with North American MH same-property Net Operating Income (NOI) growing by 10.1% for the quarter ended September 30, 2025. That kind of NOI growth signals significant pricing leverage for Sun Communities, Inc. (SUI).
The pricing power is further quantified by the preliminary guidance for the next fiscal year. Sun Communities, Inc. (SUI) established preliminary 2026 full-year rental rate guidance of 5.0% for Manufactured Housing. This is backed by the fact that through the end of September 2025, about 50% of MH residents had already received their 2026 rent increase notices, averaging approximately 5%. That's a clear demonstration of the company setting the terms.
For the Recreational Vehicle (RV) and Marina customer base, the power dynamic shifts slightly, as you noted. These customers generally have more choice in transient locations, and the RV segment saw same-property NOI decline by 1.1% for the quarter. However, Sun Communities, Inc. (SUI)'s focus on resort quality in its RV portfolio is designed to foster loyalty, mitigating some of that choice advantage. To encourage retention in the annual RV segment, management set preliminary 2026 annual rental rate increases around 4.0%, which is lower than the MH increases, suggesting a strategic balance between maximizing revenue and maintaining a stable, high-value customer base.
Here is a quick look at the key metrics underpinning the customer power assessment:
| Metric | Segment | Value (as of Q3 2025) | Context/Guidance |
| Same Property Occupancy | MH and Annual RV Sites (North America) | 98.4% | As of September 30, 2025 |
| Same Property NOI Growth | Manufactured Housing (North America) | 10.1% | For the quarter ended September 30, 2025 |
| Preliminary 2026 Rent Increase Guidance | Manufactured Housing (MH) | 5.0% | Indicating pricing power |
| Average 2026 Rent Notices Sent | Manufactured Housing (MH) | Approximately 5% | Reported through end of September 2025 |
| Preliminary 2026 Rental Rate Guidance | Annual RV Sites | Approximately 4.0% | Set to prioritize retention |
| Same Property NOI Change | RV Segment (North America) | Decline of 1.1% | For the quarter ended September 30, 2025 |
The overall picture for Sun Communities, Inc. (SUI) is that the customer power is low, especially within the highly sticky MH portfolio, which is the bedrock of the company's stability. You can see this reflected in the high occupancy and the ability to implement rent increases that outpace general inflation expectations.
Key factors influencing customer power:
- High switching costs for MH residents.
- North America MH occupancy near 98%.
- MH segment NOI grew 10.1% in Q3 2025.
- Preliminary 2026 MH rent increase guidance is 5.0%.
- RV segment faces more choice, but resort quality builds loyalty.
- Preliminary 2026 Annual RV rate increase guidance is 4.0%.
Finance: draft 13-week cash view by Friday.
Sun Communities, Inc. (SUI) - Porter's Five Forces: Competitive rivalry
You're looking at the competitive landscape for Sun Communities, Inc. (SUI) right now, late in 2025. Honestly, the rivalry here isn't a cutthroat price war; it's more of a strategic dance between a few major players and a sea of smaller operators. The rivalry is moderate, primarily centered on Equity Lifestyle Properties (ELS) and numerous private operators.
The sheer scale of the industry means Sun Communities, Inc. (SUI) is a major force, but it doesn't dominate everything. The total Residential RV & Trailer Park Operators industry revenue in the United States is an estimated $11.8 billion in 2025, spread across 52,432 businesses. Sun Communities, Inc. (SUI) itself owns, operates, or has an interest in 501 properties comprising approximately 174,450 developed sites as of June 30, 2025. While the specific 11.1% market share figure you mentioned isn't directly verifiable in the latest reports, the numbers clearly show Sun Communities, Inc. (SUI) operates at a scale that few can match, evidenced by its $15.9 billion market capitalization as of November 2025.
Competition isn't won on the cheapest lot rent alone; it's about the whole package. Operators compete heavily on location-think Sunbelt demand-amenities, and the quality of service provided to residents. For instance, in Q1 2025, Sun Communities, Inc. (SUI) saw its manufactured housing (MH) same-property Net Operating Income (NOI) jump 8.9%, driven by strong rental rate increases and high tenant retention. Meanwhile, ELS reported an average MH rent per site of $895 in Q1 2025, which was the highest among the major REITs at that time.
Here's a quick look at how the two largest players stacked up recently, which shows where the real battle for operational excellence is fought:
| Metric (As of Mid-2025 Data) | Sun Communities, Inc. (SUI) | Equity Lifestyle Properties (ELS) |
|---|---|---|
| MH Same-Property NOI Growth (Q2 2025) | 7.7% | 5.8% (Rate Growth) |
| Total Debt Outstanding (As of Q1 2025) | $7.4 billion | Leverage Ratio (Early 2025) of 4.6x |
| Total Communities (As of Mid-2025) | 501 | Not explicitly stated in latest data |
The high capital investment required to acquire and develop these specialized communities, coupled with the existing scale, definitely creates a competitive moat against smaller firms. The industry itself benefits from high barriers to entry and low supply growth, which allows established players like Sun Communities, Inc. (SUI) to push rental rates significantly above inflation. This is why Sun Communities, Inc. (SUI) is making strategic, large-scale capital moves, such as the $5.25 billion cash consideration from the Safe Harbor Marinas sale in April 2025, which is being redeployed into its core business. This financial flexibility to invest in growth is a key differentiator.
The factors driving competitive positioning include:
- Location quality in supply-constrained markets.
- Quality and modernity of community amenities.
- Operational efficiency and resident service levels.
- Ability to secure and deploy large-scale capital.
- Success in converting transient RV sites to annual leases for stability.
What this estimate hides, though, is the localized competition from smaller, private operators who might dominate a specific regional market or niche within the 52,432 total businesses. Still, Sun Communities, Inc. (SUI)'s focus on recurring rental income-which generated 90% of NOI from MH and RV communities post-marina sale-shows a clear strategy to compete on stability over volatility.
Sun Communities, Inc. (SUI) - Porter's Five Forces: Threat of substitutes
The threat of substitutes for Sun Communities, Inc. (SUI)'s core manufactured housing (MH) business remains structurally low. This is fundamentally driven by the significant cost differential between MH lot rentals and conventional housing alternatives. You are looking at a product that consistently positions itself as the most affordable non-subsidized housing option available in the market.
The financial gap between renting a manufactured home lot and securing traditional housing is substantial, which severely limits the substitution threat for residents seeking long-term, stable housing. Here is a look at the comparative costs based on late 2025 data:
| Housing Type | Typical Monthly Cost Metric | Reported Amount (Late 2025 Estimates) |
|---|---|---|
| National Average One-Bedroom Apartment Rent | Monthly Rent | $1,525 |
| Average New Single-Family Home Mortgage Payment | Monthly Payment | $2,133 |
| Average U.S. Manufactured Home Lot Rent | Monthly Lot Rent | Around $400 |
| Total Monthly Cost (New MH Loan + Lot Rent) | Estimated Monthly Total | Around $1,000 |
| Cost Savings of Mobile Home Rental vs. Apartment | Percentage Reduction | 40-60% less than apartments |
This affordability advantage is clearly reflected in the operational performance of Sun Communities, Inc. (SUI)'s MH segment. The sustained demand translates directly into strong financial metrics, which is a key indicator that substitutes are not effectively drawing away customers. For the third quarter of 2025, the manufactured housing same-property Net Operating Income (NOI) growth was a robust 10.1% year-over-year. Furthermore, the company's preliminary guidance for 2026 annual rental rate increases for MH is set at 5.0%, and through September 2025, 50% of MH residents had already received 2026 rent increase notices averaging approximately 5%.
The threat of substitutes is higher, though still manageable, in Sun Communities, Inc. (SUI)'s recreational vehicle (RV) resort segment, as this competes with traditional hospitality options like hotels and short-term vacation rentals. However, the RV resort model offers a different value proposition centered on space and experience, which mitigates direct price competition in many scenarios.
When comparing nightly costs for a comparable experience, RV resorts generally present a lower base rate than traditional hotels, though the total trip cost depends heavily on travel frequency and amenities used. Here is a snapshot of the late 2025 competitive landscape for transient stays:
- Private RV resort nightly rates range from $40 to $100, with high-end resorts reaching $150+.
- Budget hotel nightly rates generally start from $80 to $150.
- Mid-range hotel rates often fall between $150 and $300 per night.
- Luxury hotel rates can exceed $500 per night.
The occupancy figures for Sun Communities, Inc. (SUI)'s combined MH and annual RV sites at September 30, 2025, stood at 98.4%, with the North America Same Property adjusted blended occupancy at 99.2%. This high utilization suggests that even with the substitute threat from hotels, the demand for the RV resort product, particularly the annual/long-term sites which are often converted from transient, remains exceptionally strong. The company's strategy of converting transient sites to annual RV sites further solidifies recurring revenue, effectively lowering the impact of the more volatile hotel/vacation rental market on their core RV revenue base.
Sun Communities, Inc. (SUI) - Porter's Five Forces: Threat of new entrants
The threat of new entrants for Sun Communities, Inc. (SUI) remains low, primarily because the barriers to entry in the manufactured housing (MH) and recreational vehicle (RV) community sector are exceptionally high. You can't just decide to build a new community next quarter; the hurdles are significant, defintely making it tough for smaller players to scale up.
- Threat is low due to extremely high capital requirements for land acquisition.
Securing suitable, large tracts of land that can be zoned for community development requires massive upfront capital deployment. This isn't just the land cost; it's the carrying costs while you wait for approvals. For context on the broader construction environment, a chronic supply of construction labor cost the homebuilding industry an estimated $10.8 billion in lost construction and delays, illustrating the financial risk inherent in large-scale development projects.
- Zoning and permitting for new MH/RV communities are notoriously difficult and slow.
The regulatory landscape is a major deterrent. New entrants face a patchwork of local ordinances, zoning restrictions, and infrastructure requirements that vary significantly by municipality. For RV parks, for example, securing land use permits requires detailed site plans, environmental impact assessments, and traffic studies, all subject to local authority review and potential objections. Furthermore, in 2025, the elimination of the Affirmatively Furthering Fair Housing (AFFH) rule has granted local governments even more control over zoning and housing policies, which can complicate or slow down development plans for newcomers.
Here's a quick look at some of the scale and financial positioning that creates this barrier:
| Metric | Value / Date | Context |
|---|---|---|
| Net Debt to Recurring EBITDA | 3.3x (As of September 30, 2025) | Indicates strong leverage capacity relative to operating cash flow. |
| Total Debt Outstanding | $4.3 billion (As of September 30, 2025) | Represents the massive capital base required to operate at SUI's scale. |
| Weighted Average Interest Rate | 3.4% (As of September 30, 2025) | Suggests favorable terms derived from established market access. |
| Construction Labor Delay Cost | $10.8 billion (Industry Estimate) | Illustrates the financial impact of delays in the related development sector. |
- SUI's pro forma Net Debt to Recurring EBITDA of 3.3x shows superior access to capital.
When you look at Sun Communities, Inc.'s balance sheet as of September 30, 2025, their Net Debt to trailing twelve-month Recurring EBITDA ratio stood at 3.3 times. This relatively conservative leverage, especially given their $4.3 billion in outstanding debt, signals to lenders that Sun Communities, Inc. has a robust and reliable cash flow stream. This financial strength allows them to secure capital-debt or equity-on better terms and faster than a new entrant could hope to match. They can absorb the high initial costs and regulatory delays much more easily.
- Established economies of scale and operating platform are hard to replicate quickly.
Sun Communities, Inc. has spent years building out an operating platform that manages thousands of sites across North America. This scale translates directly into purchasing power for utilities and services, optimized management systems, and established relationships with local governments and suppliers. A new competitor would need years to build the necessary portfolio size to achieve comparable operational efficiencies. Also, the sheer volume of properties under management is a competitive moat that takes time and immense capital to cross.
- Land acquisition is capital-intensive and geographically constrained.
- Regulatory approval timelines are often measured in years, not months.
- SUI's existing portfolio size drives superior operating leverage.
- Access to institutional debt markets is a key advantage.
Finance: draft 13-week cash view by Friday.
Disclaimer
All information, articles, and product details provided on this website are for general informational and educational purposes only. We do not claim any ownership over, nor do we intend to infringe upon, any trademarks, copyrights, logos, brand names, or other intellectual property mentioned or depicted on this site. Such intellectual property remains the property of its respective owners, and any references here are made solely for identification or informational purposes, without implying any affiliation, endorsement, or partnership.
We make no representations or warranties, express or implied, regarding the accuracy, completeness, or suitability of any content or products presented. Nothing on this website should be construed as legal, tax, investment, financial, medical, or other professional advice. In addition, no part of this site—including articles or product references—constitutes a solicitation, recommendation, endorsement, advertisement, or offer to buy or sell any securities, franchises, or other financial instruments, particularly in jurisdictions where such activity would be unlawful.
All content is of a general nature and may not address the specific circumstances of any individual or entity. It is not a substitute for professional advice or services. Any actions you take based on the information provided here are strictly at your own risk. You accept full responsibility for any decisions or outcomes arising from your use of this website and agree to release us from any liability in connection with your use of, or reliance upon, the content or products found herein.