
|
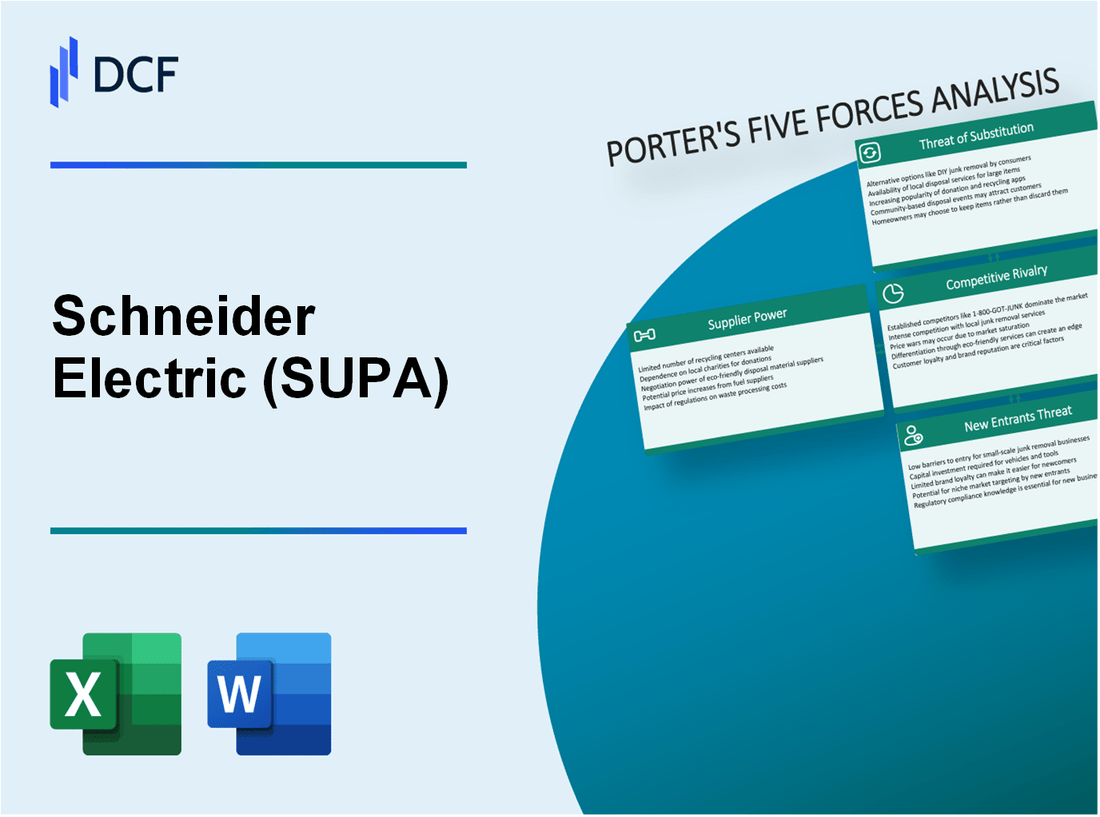
Schneider Electric S.E. (SU.PA): Porter's 5 Forces Analysis |
Fully Editable: Tailor To Your Needs In Excel Or Sheets
Professional Design: Trusted, Industry-Standard Templates
Investor-Approved Valuation Models
MAC/PC Compatible, Fully Unlocked
No Expertise Is Needed; Easy To Follow
Schneider Electric S.E. (SU.PA) Bundle
In the dynamic landscape of energy management, understanding the competitive forces at play is vital for any investor or business analyst. Schneider Electric S.E. navigates a complex environment shaped by the bargaining power of suppliers and customers, fierce competitive rivalry, the looming threat of substitutes, and barriers to new entrants. Exploring these factors through Michael Porter’s Five Forces Framework reveals key insights into Schneider's strategic positioning and market resilience. Dive deeper to uncover how these forces shape the company's future and profitability.
Schneider Electric S.E. - Porter's Five Forces: Bargaining power of suppliers
The bargaining power of suppliers in the context of Schneider Electric is influenced by several factors that interplay with the company's operational structure and market positioning.
Diverse supplier base reduces dependency
Schneider Electric operates with a broad supplier network, consisting of over 3,000 suppliers globally. This diversification mitigates risks associated with supplier dependency and enables negotiation flexibility. As of 2022, around 86% of their suppliers were local or regional, which strengthens relationships and reduces logistical costs.
Specialized technology components elevate supplier influence
The company relies on specialized components, including semiconductors and control systems. For instance, Schneider Electric reported spending approximately €7 billion annually on these technologies. The limited availability of high-performance components gives suppliers a significant edge, as many of these specialized inputs are crucial for Schneider's innovative product lines.
High switching costs due to unique inputs
Switching costs for Schneider are elevated due to the uniqueness of certain components, particularly in their IoT (Internet of Things) and digital solutions segments. Customization of systems often leads to investments in supplier-specific training and systems integration, with estimates around 10-15% of operational costs associated with switching suppliers. This creates a barrier that suppliers can leverage to maintain pricing power.
Long-term contracts stabilize supplier relationships
Schneider Electric utilizes long-term contracts to ensure price stability and secure supply availability. As of 2023, approximately 60% of their supplier agreements were structured as long-term contracts, helping to minimize cost fluctuations and stabilize supplier relationships.
Vertical integration minimizes supplier power
Schneider Electric has made strategic moves towards vertical integration, particularly in its manufacturing processes. The acquisition of companies like AVEVA Group plc in 2021 for €3.9 billion highlights this approach. By integrating more capabilities in-house, Schneider reduces reliance on external suppliers, subsequently diminishing their bargaining power.
| Factor | Details | Impact on Supplier Power |
|---|---|---|
| Diverse Supplier Base | 3,000+ suppliers globally; 86% local/regional | Reduces dependency and enhances negotiation power |
| Specialized Components | Annual spend of €7 billion on tech components | Increases supplier influence due to scarcity |
| High Switching Costs | 10-15% operational costs tied to supplier transitions | Strengthens supplier leverage over pricing |
| Long-term Contracts | 60% of agreements are long-term | Stabilizes costs and relationships with suppliers |
| Vertical Integration | Acquisition of AVEVA for €3.9 billion | Reduces external dependency and supplier power |
Schneider Electric S.E. - Porter's Five Forces: Bargaining power of customers
The customer base of Schneider Electric spans a wide range of industrial sectors, including utilities, infrastructure, data centers, buildings, and industries. In 2022, Schneider Electric generated approximately €29.2 billion in revenue, with a significant proportion coming from diverse industries. This broad customer portfolio allows the company to mitigate risks but also means customers wield varying levels of bargaining power depending on their specific sector.
High product differentiation in Schneider Electric’s offerings, such as energy management and automation solutions, plays a critical role in reducing customer leverage. For instance, the company's EcoStruxure platform, which provides IoT-enabled solutions, enhances value through customized services and products that cater to specific industrial needs. As a result, Schneider Electric’s gross margin stood at approximately 36.4% in 2022, indicative of strong pricing power stemming from differentiated offerings.
Furthermore, the increasing demand for sustainable solutions has positioned Schneider Electric favorably, enhancing its pricing power. The global market for energy-efficient technologies is expected to grow from €550 billion in 2021 to around €1.2 trillion by 2030, as businesses seek to meet sustainability targets. Schneider's commitment to sustainability, reflected in their goal to achieve net-zero emissions by 2025, further strengthens its brand positioning.
Schneider Electric's strong brand reputation significantly contributes to customer loyalty. In 2022, the company ranked 3rd in the Global 100 Most Sustainable Corporations in the World index. This recognition not only enhances customer loyalty but also reduces the propensity for customers to switch to competitors, thereby limiting their bargaining power.
The ongoing digital transformation has heightened customer expectations regarding product functionality, integration, and service. Schneider Electric's push into the digital space, with offerings like the Schneider Electric Exchange, enhances customer engagement and satisfaction. This transition reflects in their customer satisfaction metrics, with a Net Promoter Score (NPS) of approximately 43 in 2022, indicating strong customer loyalty and endorsement.
| Year | Revenue (€ billion) | Gross Margin (%) | Market Size for Energy-Efficient Technologies (€ trillion) | NPS Score |
|---|---|---|---|---|
| 2022 | 29.2 | 36.4 | 1.2 (by 2030) | 43 |
| 2021 | 26.9 | 34.8 | 0.55 | N/A |
Schneider Electric S.E. - Porter's Five Forces: Competitive rivalry
Schneider Electric operates in a highly competitive energy management sector, facing numerous competitors globally. Key players include General Electric (GE), Siemens AG, and ABB Ltd., each with their own strengths and unique market offerings. The market is characterized by a mix of large established firms and smaller innovative companies, resulting in a fragmented competitive landscape.
The energy management and automation market is projected to reach a value of $185 billion by 2025, growing at a CAGR of approximately 8% from $115 billion in 2020. Schneider Electric has a market share of about 4% in this sector, indicating its substantial presence but also the fierce competition it faces.
Innovation plays a critical role in driving product differentiation. In 2022, Schneider Electric invested approximately $1.6 billion, or about 5.3% of its total revenue, into R&D. This investment is aimed at enhancing their offerings, especially in areas such as IoT and sustainability solutions. Competitors like Siemens increased their R&D spending to $5 billion in 2022, highlighting the competitive pressure to innovate.
Price competition is a significant factor impacting profitability. Schneider Electric's operating margin in 2022 was approximately 15%, which is below competitors like ABB, which reported an operating margin of around 17%. The pressure to lower prices, particularly in emerging markets, can erode margins, as companies strive to gain market share. In 2023, it was reported that the average price of components in the energy management sector saw a year-over-year decline of 6%.
With a global reach, Schneider Electric must adopt regional strategies to remain competitive. In 2022, revenue from North America accounted for 35% of total revenue, while Europe represented about 30%. The Asia-Pacific region is emerging as a critical growth area, accounting for nearly 25% of revenue, reflecting a push into markets with increasing demand for energy management solutions.
Strategic alliances and partnerships further enhance Schneider Electric's competitive edge. The company has established partnerships with major technology firms like Microsoft and Cisco. These alliances allow Schneider to leverage cloud computing and IoT capabilities. In 2023, Schneider Electric and Microsoft announced a joint initiative aiming for a reduction in carbon emissions by 30% across their operations, aligning with market trends towards sustainability.
| Company | R&D Investment (2022) | Market Share (%) (2022) | Operating Margin (%) (2022) | Revenue Contribution by Region (%) |
|---|---|---|---|---|
| Schneider Electric | $1.6 billion | 4 | 15 | North America: 35 Europe: 30 Asia-Pacific: 25 |
| Siemens AG | $5 billion | 14 | 17 | North America: 30 Europe: 40 Asia-Pacific: 20 |
| ABB Ltd. | $1.5 billion | 10 | 17 | North America: 25 Europe: 35 Asia-Pacific: 30 |
| General Electric | $4 billion | 9 | 13 | North America: 40 Europe: 30 Asia-Pacific: 20 |
Overall, the competitive rivalry faced by Schneider Electric is marked by numerous factors, including a multitude of strong competitors, the necessity for continuous innovation, pressures from price competition, the need for tailored regional strategies, and the importance of strategic partnerships. These dynamics collectively shape the company’s approach to maintaining its market position.
Schneider Electric S.E. - Porter's Five Forces: Threat of substitutes
The renewable energy sector is growing rapidly, providing significant substitutes for traditional energy solutions. In 2022, global renewable energy capacity reached approximately 3,064 GW, with solar and wind energy leading the way. The International Energy Agency (IEA) estimates that renewable energy could account for around 95% of the increase in global power generation by 2026. Schneider Electric, focused on energy management and automation solutions, faces this mounting competition as customers increasingly consider renewable options as viable alternatives.
Technological advancements also play a crucial role in the threat of substitutes. Energy efficiency technologies have advanced significantly, making energy savings more accessible to consumers. The market for smart energy solutions is projected to grow from $82.2 billion in 2020 to $138.9 billion by 2026, at a CAGR of 9.5%. Schneider Electric's competitors are continually innovating, offering new products that enhance energy savings and efficiency, which can threaten Schneider's market share.
However, the high cost of switching between suppliers and solutions limits substitutability. According to a 2021 survey by Accenture, 70% of industrial customers indicated that they would not switch immediately to alternative solutions due to the costs associated with changing suppliers. Schneider Electric's entrenched customer relationships and established systems also create a barrier to substitution, as many clients face significant capital and operational expenditures to transition to alternative solutions.
To counter the threat posed by substitutes, Schneider Electric maintains a strong focus on research and development (R&D). In 2022, the company invested approximately €1.5 billion in R&D, aiming to drive innovation and maintain its competitive edge. This investment accounts for around 4.7% of Schneider Electric's total revenue. By consistently enhancing product offerings, Schneider aims to differentiate itself from substitutes in the market.
Integrated solutions provide another competitive advantage for Schneider Electric. The company’s EcoStruxure platform, which combines IoT-enabled solutions across various sectors, garnered a significant market share, contributing to a reported revenue of €25.7 billion in 2022. This integrated approach not only fosters customer loyalty but also positions Schneider Electric to address the multifaceted needs of clients, effectively reducing the appeal of substitutes.
| Aspect | Statistic/Financial Figure |
|---|---|
| Global Renewable Energy Capacity (2022) | 3,064 GW |
| Projected Renewable Energy Share of Power Generation (2026) | 95% |
| Smart Energy Solutions Market Size (2020-2026) | From $82.2 billion to $138.9 billion |
| Industrial Customers Reluctance to Switch (2021) | 70% |
| Schneider Electric R&D Investment (2022) | €1.5 billion |
| R&D as Percentage of Total Revenue (2022) | 4.7% |
| Revenue from EcoStruxure Platform (2022) | €25.7 billion |
Schneider Electric S.E. - Porter's Five Forces: Threat of new entrants
The threat of new entrants in the market where Schneider Electric S.E. operates is influenced by several significant factors.
High capital requirements deter new entrants
The capital requirements to enter the electrical equipment and energy management sector are substantial. Schneider Electric reported annual revenues of approximately €30 billion in 2022, indicating the scale of investment needed to compete effectively. New entrants would require significant funding to establish manufacturing plants, develop products, and build distribution networks.
Strong brand recognition acts as a barrier
Schneider Electric has built a strong brand recognized globally for innovation and sustainability, with over 140 years of industry presence. According to a brand valuation report from Brand Finance in 2023, Schneider Electric has a brand value of approximately $7.1 billion, enhancing customer loyalty and trust, which is difficult for newcomers to replicate.
Economies of scale favor established players
Established players like Schneider Electric benefit from economies of scale. The company can produce at lower costs per unit due to its extensive operations across 100+ countries. In 2022, Schneider Electric’s gross profit margin was around 27.5%, showcasing the cost advantages gained through large-scale production compared to potential new entrants.
Regulatory requirements restrict market entry
The industry is heavily regulated with compliance requirements around safety, environmental impact, and energy efficiency. The European Union’s regulations on electrical products impact market entry strategies, with compliance costs estimated to account for up to 15% of a new entrant’s initial investment. Non-compliance may result in fines or market exclusion.
Advanced technology infrastructure needed for entry
The necessity for advanced technology infrastructure acts as a barrier to new entrants. Schneider Electric invests heavily in R&D, with expenditures reaching €1.5 billion in 2022, allowing it to remain at the forefront of innovation in digital transformation and IoT solutions in energy management. New entrants would need to similarly invest heavily in technology to compete.
| Barrier to Entry | Description | Impact on New Entrants |
|---|---|---|
| Capital Requirements | High initial investments required, approximately €30 billion in revenues to compete. | High |
| Brand Recognition | Strong brand value at approximately $7.1 billion in 2023. | High |
| Economies of Scale | Gross profit margin of approximately 27.5% in 2022. | High |
| Regulatory Requirements | Compliance costs estimated at 15% of initial investment. | Medium |
| Technology Infrastructure | R&D investment of €1.5 billion in 2022. | High |
Understanding the dynamics of Porter's Five Forces provides invaluable insight into Schneider Electric S.E.'s strategic position within the energy management sector. By navigating supplier relationships, responding to customer expectations, competing effectively, countering substitute threats, and setting barriers against new entrants, Schneider Electric not only safeguards its market share but also adapts to an ever-evolving landscape, ensuring its commitment to innovation and sustainability remains unwavering.
[right_small]Disclaimer
All information, articles, and product details provided on this website are for general informational and educational purposes only. We do not claim any ownership over, nor do we intend to infringe upon, any trademarks, copyrights, logos, brand names, or other intellectual property mentioned or depicted on this site. Such intellectual property remains the property of its respective owners, and any references here are made solely for identification or informational purposes, without implying any affiliation, endorsement, or partnership.
We make no representations or warranties, express or implied, regarding the accuracy, completeness, or suitability of any content or products presented. Nothing on this website should be construed as legal, tax, investment, financial, medical, or other professional advice. In addition, no part of this site—including articles or product references—constitutes a solicitation, recommendation, endorsement, advertisement, or offer to buy or sell any securities, franchises, or other financial instruments, particularly in jurisdictions where such activity would be unlawful.
All content is of a general nature and may not address the specific circumstances of any individual or entity. It is not a substitute for professional advice or services. Any actions you take based on the information provided here are strictly at your own risk. You accept full responsibility for any decisions or outcomes arising from your use of this website and agree to release us from any liability in connection with your use of, or reliance upon, the content or products found herein.