
|
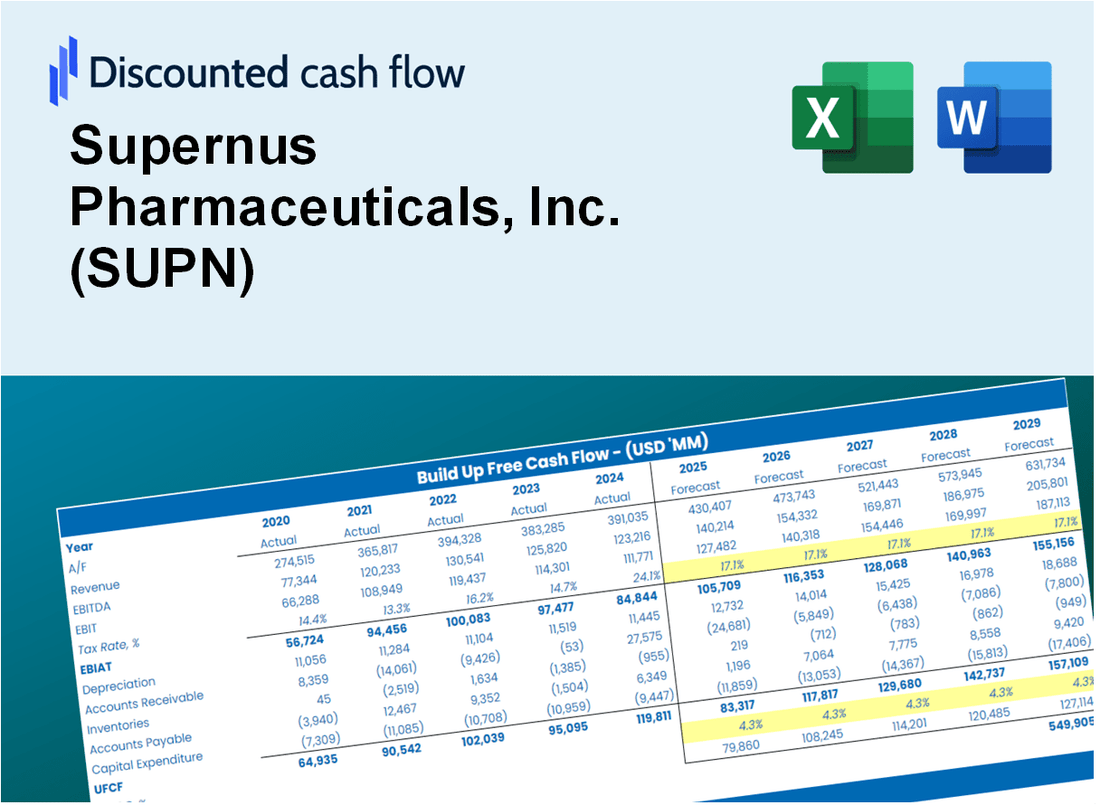
Supernus Pharmaceuticals, Inc. (SUPN) DCF Valuation |
Fully Editable: Tailor To Your Needs In Excel Or Sheets
Professional Design: Trusted, Industry-Standard Templates
Investor-Approved Valuation Models
MAC/PC Compatible, Fully Unlocked
No Expertise Is Needed; Easy To Follow
Supernus Pharmaceuticals, Inc. (SUPN) Bundle
Gain mastery over your Supernus Pharmaceuticals, Inc. (SUPN) valuation analysis using our state-of-the-art DCF Calculator! This Excel template comes preloaded with real (SUPN) data, enabling you to adjust forecasts and assumptions to accurately determine the intrinsic value of Supernus Pharmaceuticals, Inc.
Discounted Cash Flow (DCF) - (USD MM)
| Year | AY1 2020 |
AY2 2021 |
AY3 2022 |
AY4 2023 |
AY5 2024 |
FY1 2025 |
FY2 2026 |
FY3 2027 |
FY4 2028 |
FY5 2029 |
|---|---|---|---|---|---|---|---|---|---|---|
| Revenue | 520.4 | 579.8 | 667.2 | 607.5 | 661.8 | 705.6 | 752.4 | 802.2 | 855.3 | 911.9 |
| Revenue Growth, % | 0 | 11.41 | 15.09 | -8.95 | 8.94 | 6.62 | 6.62 | 6.62 | 6.62 | 6.62 |
| EBITDA | 210.5 | 129.2 | 153.4 | 90.0 | 178.3 | 179.9 | 191.8 | 204.5 | 218.1 | 232.5 |
| EBITDA, % | 40.46 | 22.28 | 22.98 | 14.82 | 26.94 | 25.5 | 25.5 | 25.5 | 25.5 | 25.5 |
| Depreciation | 18.1 | 32.6 | 85.5 | 84.9 | 80.4 | 67.8 | 72.3 | 77.1 | 82.2 | 87.6 |
| Depreciation, % | 3.49 | 5.62 | 12.82 | 13.97 | 12.15 | 9.61 | 9.61 | 9.61 | 9.61 | 9.61 |
| EBIT | 192.4 | 96.6 | 67.8 | 5.2 | 97.9 | 112.1 | 119.5 | 127.4 | 135.9 | 144.9 |
| EBIT, % | 36.97 | 16.66 | 10.16 | 0.8533 | 14.79 | 15.89 | 15.89 | 15.89 | 15.89 | 15.89 |
| Total Cash | 422.5 | 339.7 | 461.3 | 254.9 | 453.6 | 450.8 | 480.6 | 512.5 | 546.4 | 582.6 |
| Total Cash, percent | .0 | .0 | .0 | .0 | .0 | .0 | .0 | .0 | .0 | .0 |
| Account Receivables | 140.9 | 148.9 | 165.5 | 144.2 | 142.1 | 173.2 | 184.7 | 196.9 | 210.0 | 223.9 |
| Account Receivables, % | 27.07 | 25.69 | 24.8 | 23.73 | 21.47 | 24.55 | 24.55 | 24.55 | 24.55 | 24.55 |
| Inventories | 48.3 | 86.0 | 91.5 | 77.4 | 54.3 | 83.0 | 88.4 | 94.3 | 100.5 | 107.2 |
| Inventories, % | 9.29 | 14.83 | 13.72 | 12.74 | 8.2 | 11.76 | 11.76 | 11.76 | 11.76 | 11.76 |
| Accounts Payable | 6.1 | 9.3 | 10.5 | 2.0 | 4.6 | 7.6 | 8.1 | 8.6 | 9.2 | 9.8 |
| Accounts Payable, % | 1.18 | 1.61 | 1.58 | 0.32328 | 0.69309 | 1.08 | 1.08 | 1.08 | 1.08 | 1.08 |
| Capital Expenditure | -3.4 | -2.0 | -.4 | -.6 | -.7 | -1.8 | -1.9 | -2.0 | -2.2 | -2.3 |
| Capital Expenditure, % | -0.66276 | -0.35272 | -0.06174708 | -0.09069645 | -0.10955 | -0.2555 | -0.2555 | -0.2555 | -0.2555 | -0.2555 |
| Tax Rate, % | 24.53 | 24.53 | 24.53 | 24.53 | 24.53 | 24.53 | 24.53 | 24.53 | 24.53 | 24.53 |
| EBITAT | 144.8 | 70.5 | 67.8 | 2.5 | 73.9 | 83.2 | 88.7 | 94.6 | 100.9 | 107.6 |
| Depreciation | ||||||||||
| Changes in Account Receivables | ||||||||||
| Changes in Inventories | ||||||||||
| Changes in Accounts Payable | ||||||||||
| Capital Expenditure | ||||||||||
| UFCF | -23.5 | 58.6 | 132.0 | 113.7 | 181.4 | 92.4 | 142.7 | 152.1 | 162.2 | 172.9 |
| WACC, % | 6.99 | 6.99 | 7 | 6.97 | 6.99 | 6.99 | 6.99 | 6.99 | 6.99 | 6.99 |
| PV UFCF | ||||||||||
| SUM PV UFCF | 582.4 | |||||||||
| Long Term Growth Rate, % | 4.00 | |||||||||
| Free cash flow (T + 1) | 180 | |||||||||
| Terminal Value | 6,021 | |||||||||
| Present Terminal Value | 4,296 | |||||||||
| Enterprise Value | 4,878 | |||||||||
| Net Debt | -35 | |||||||||
| Equity Value | 4,913 | |||||||||
| Diluted Shares Outstanding, MM | 56 | |||||||||
| Equity Value Per Share | 87.80 |
What You Will Get
- Pre-Filled Financial Model: Supernus Pharmaceuticals' actual data facilitates accurate DCF valuation.
- Full Forecast Control: Modify revenue growth, profit margins, WACC, and other essential drivers.
- Instant Calculations: Automatic updates provide immediate results as you adjust inputs.
- Investor-Ready Template: A polished Excel file crafted for high-quality valuation presentations.
- Customizable and Reusable: Designed for adaptability, allowing for repeated use in comprehensive forecasts.
Key Features
- Comprehensive SUPN Data: Pre-filled with Supernus Pharmaceuticals’ historical financials and future projections.
- Fully Customizable Inputs: Modify revenue growth, profit margins, WACC, tax rates, and capital expenditures.
- Dynamic Valuation Model: Automatic updates to Net Present Value (NPV) and intrinsic value based on your inputs.
- Scenario Testing: Develop multiple forecast scenarios to evaluate various valuation outcomes.
- User-Friendly Design: Intuitive, organized, and suitable for both professionals and novices.
How It Works
- Step 1: Download the Excel file.
- Step 2: Review pre-entered Supernus Pharmaceuticals data (historical and projected).
- Step 3: Adjust key assumptions (yellow cells) based on your analysis.
- Step 4: View automatic recalculations for Supernus Pharmaceuticals’ intrinsic value.
- Step 5: Use the outputs for investment decisions or reporting.
Why Choose This Calculator for Supernus Pharmaceuticals, Inc. (SUPN)?
- Accurate Data: Real Supernus financials provide dependable valuation outcomes.
- Customizable: Tailor key inputs such as growth rates, WACC, and tax rates to align with your forecasts.
- Time-Saving: Pre-configured calculations save you from building from the ground up.
- Professional-Grade Tool: Crafted for investors, analysts, and consultants in the pharmaceutical sector.
- User-Friendly: Easy-to-navigate design and clear instructions ensure accessibility for all users.
Who Should Use Supernus Pharmaceuticals, Inc. (SUPN)?
- Investors: Gain insights into pharmaceutical investments with detailed market analysis.
- Healthcare Analysts: Utilize comprehensive data to evaluate drug performance and market potential.
- Consultants: Tailor reports and presentations using Supernus' strategic insights for client needs.
- Pharmaceutical Enthusiasts: Enhance your knowledge of drug development and market trends with real-life case studies.
- Educators and Students: Leverage this information as a resource for learning about the pharmaceutical industry.
What the Template Contains
- Comprehensive DCF Model: Editable template featuring detailed valuation calculations tailored for Supernus Pharmaceuticals, Inc. (SUPN).
- Real-World Data: Supernus’s historical and projected financials preloaded for in-depth analysis.
- Customizable Parameters: Modify WACC, growth rates, and tax assumptions to explore various scenarios.
- Financial Statements: Complete annual and quarterly breakdowns providing deeper insights into the company's performance.
- Key Ratios: Integrated analysis for profitability, efficiency, and leverage specific to Supernus Pharmaceuticals, Inc. (SUPN).
- Dashboard with Visual Outputs: Charts and tables designed for clear, actionable results to aid decision-making.
Disclaimer
All information, articles, and product details provided on this website are for general informational and educational purposes only. We do not claim any ownership over, nor do we intend to infringe upon, any trademarks, copyrights, logos, brand names, or other intellectual property mentioned or depicted on this site. Such intellectual property remains the property of its respective owners, and any references here are made solely for identification or informational purposes, without implying any affiliation, endorsement, or partnership.
We make no representations or warranties, express or implied, regarding the accuracy, completeness, or suitability of any content or products presented. Nothing on this website should be construed as legal, tax, investment, financial, medical, or other professional advice. In addition, no part of this site—including articles or product references—constitutes a solicitation, recommendation, endorsement, advertisement, or offer to buy or sell any securities, franchises, or other financial instruments, particularly in jurisdictions where such activity would be unlawful.
All content is of a general nature and may not address the specific circumstances of any individual or entity. It is not a substitute for professional advice or services. Any actions you take based on the information provided here are strictly at your own risk. You accept full responsibility for any decisions or outcomes arising from your use of this website and agree to release us from any liability in connection with your use of, or reliance upon, the content or products found herein.