
|
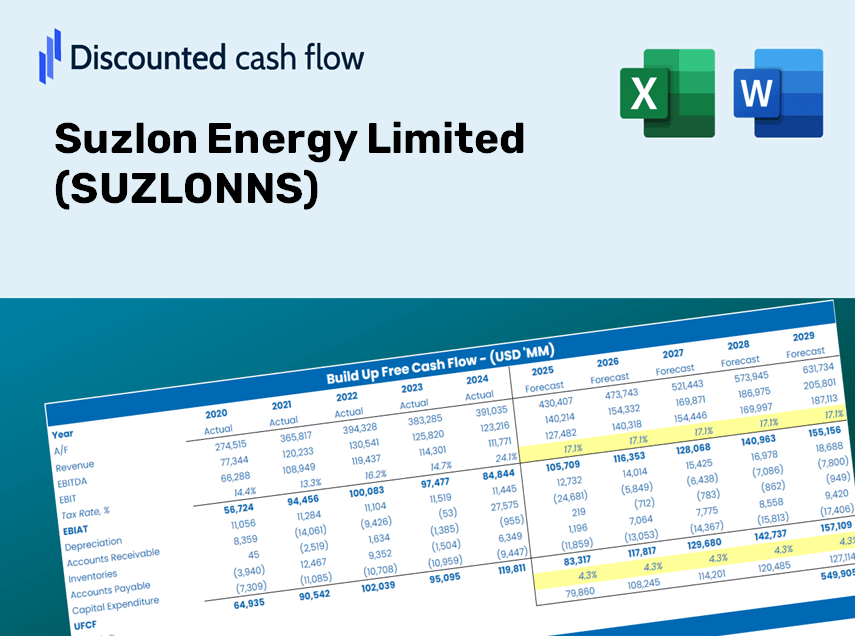
Suzlon Energy Limited (SUZLON.NS) DCF Valuation |
Fully Editable: Tailor To Your Needs In Excel Or Sheets
Professional Design: Trusted, Industry-Standard Templates
Investor-Approved Valuation Models
MAC/PC Compatible, Fully Unlocked
No Expertise Is Needed; Easy To Follow
Suzlon Energy Limited (SUZLON.NS) Bundle
Optimize your time and improve precision with our (SUZLONNS) DCF Calculator! Utilizing actual data from Suzlon Energy Limited and customizable assumptions, this tool empowers you to forecast, analyze, and value Suzlon like a seasoned investor.
What You Will Receive
- Genuine Suzlon Data: Preloaded financials – encompassing revenue to EBIT – derived from actual and projected figures.
- Comprehensive Customization: Modify all essential parameters (yellow cells) such as WACC, growth %, and tax rates.
- Immediate Valuation Updates: Automatic recalibrations to assess the effects of changes on Suzlon Energy's fair value.
- Flexible Excel Template: Designed for swift edits, scenario analyses, and intricate projections.
- Efficient and Precise: Bypass the need to construct models from the ground up while ensuring accuracy and adaptability.
Core Features
- Comprehensive DCF Calculator: Offers in-depth unlevered and levered DCF valuation models tailored for Suzlon Energy Limited (SUZLONNS).
- WACC Calculator: Features a pre-configured Weighted Average Cost of Capital sheet with adjustable inputs specific to the energy sector.
- Customizable Forecast Assumptions: Easily alter growth projections, capital expenditures, and discount rates based on market trends.
- Integrated Financial Ratios: Evaluate profitability, leverage, and efficiency ratios pertinent to Suzlon Energy Limited (SUZLONNS).
- Visualization Dashboard and Charts: Graphical representations that distill key valuation metrics for straightforward analysis.
Process Overview
- Download: Obtain the pre-loaded Excel file containing Suzlon Energy Limited’s (SUZLONNS) financial data.
- Customize: Modify projections, including revenue growth, EBITDA percentages, and WACC.
- Update Automatically: Watch as intrinsic value and NPV calculations refresh in real-time.
- Test Scenarios: Generate various forecasts and compare results instantly.
- Make Decisions: Leverage the valuation outputs to inform your investment strategy.
Why Choose This Calculator?
- User-Friendly Interface: Perfectly crafted for both newcomers and seasoned professionals.
- Customizable Parameters: Effortlessly adjust inputs to match your financial assessments.
- Real-Time Updates: Witness immediate adjustments to Suzlon Energy Limited's valuation as you tweak the data.
- Preloaded Data: Comes equipped with Suzlon's actual financial information for swift evaluations.
- Endorsed by Experts: A go-to tool for investors and analysts aiming for well-informed decisions.
Who Can Benefit from This Product?
- Investors: Assess the fair value of Suzlon Energy Limited (SUZLONNS) to inform your investment choices.
- CFOs: Utilize an advanced DCF model for precise financial reporting and analysis.
- Consultants: Effortlessly customize the template for client valuation reports.
- Entrepreneurs: Explore financial modeling practices adopted by leading companies in the energy sector.
- Educators: Implement it as a resource to illustrate valuation techniques in the classroom.
Contents of the Template
- Historical Data: Contains Suzlon Energy Limited’s past financial performance and baseline forecasts.
- DCF and Levered DCF Models: Comprehensive templates for calculating the intrinsic value of Suzlon Energy Limited (SUZLONNS).
- WACC Sheet: Pre-configured calculations for the Weighted Average Cost of Capital.
- Editable Inputs: Customize key drivers such as growth rates, EBITDA percentages, and CAPEX assumptions.
- Quarterly and Annual Statements: A thorough analysis of Suzlon Energy Limited’s financials.
- Interactive Dashboard: Dynamically visualize valuation results and projections.
Disclaimer
All information, articles, and product details provided on this website are for general informational and educational purposes only. We do not claim any ownership over, nor do we intend to infringe upon, any trademarks, copyrights, logos, brand names, or other intellectual property mentioned or depicted on this site. Such intellectual property remains the property of its respective owners, and any references here are made solely for identification or informational purposes, without implying any affiliation, endorsement, or partnership.
We make no representations or warranties, express or implied, regarding the accuracy, completeness, or suitability of any content or products presented. Nothing on this website should be construed as legal, tax, investment, financial, medical, or other professional advice. In addition, no part of this site—including articles or product references—constitutes a solicitation, recommendation, endorsement, advertisement, or offer to buy or sell any securities, franchises, or other financial instruments, particularly in jurisdictions where such activity would be unlawful.
All content is of a general nature and may not address the specific circumstances of any individual or entity. It is not a substitute for professional advice or services. Any actions you take based on the information provided here are strictly at your own risk. You accept full responsibility for any decisions or outcomes arising from your use of this website and agree to release us from any liability in connection with your use of, or reliance upon, the content or products found herein.