
|
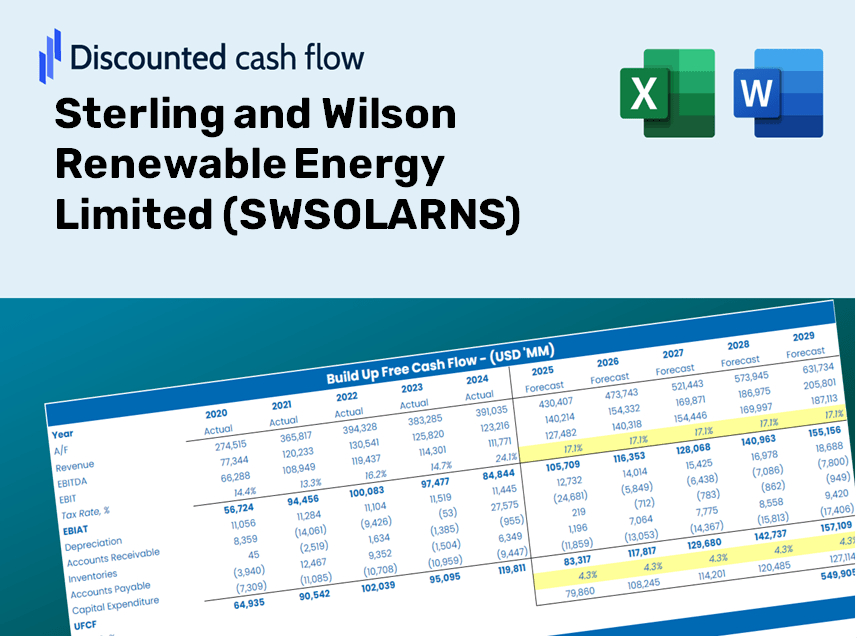
Sterling and Wilson Renewable Energy Limited (SWSOLAR.NS) DCF Valuation |
Fully Editable: Tailor To Your Needs In Excel Or Sheets
Professional Design: Trusted, Industry-Standard Templates
Investor-Approved Valuation Models
MAC/PC Compatible, Fully Unlocked
No Expertise Is Needed; Easy To Follow
Sterling and Wilson Renewable Energy Limited (SWSOLAR.NS) Bundle
Explore the financial outlook of Sterling and Wilson Renewable Energy Limited (SWSOLARNS) with our user-friendly DCF Calculator! Enter your projections for growth, margins, and expenses to determine the intrinsic value of Sterling and Wilson Renewable Energy Limited (SWSOLARNS) and enhance your investment strategy.
Discounted Cash Flow (DCF) - (USD MM)
| Year | AY1 2021 |
AY2 2022 |
AY3 2023 |
AY4 2024 |
AY5 2025 |
FY1 2026 |
FY2 2027 |
FY3 2028 |
FY4 2029 |
FY5 2030 |
|---|---|---|---|---|---|---|---|---|---|---|
| Revenue | 50,482.4 | 51,973.8 | 20,150.1 | 30,353.8 | 63,018.6 | 77,570.0 | 95,481.4 | 117,528.6 | 144,666.7 | 178,071.1 |
| Revenue Growth, % | 0 | 2.95 | -61.23 | 50.64 | 107.61 | 23.09 | 23.09 | 23.09 | 23.09 | 23.09 |
| EBITDA | -2,260.1 | -8,094.7 | -10,129.0 | 780.9 | 2,469.7 | -9,902.2 | -12,188.7 | -15,003.2 | -18,467.5 | -22,731.7 |
| EBITDA, % | -4.48 | -15.57 | -50.27 | 2.57 | 3.92 | -12.77 | -12.77 | -12.77 | -12.77 | -12.77 |
| Depreciation | 165.1 | 146.7 | 147.0 | 168.1 | 143.4 | 328.9 | 404.9 | 498.4 | 613.4 | 755.1 |
| Depreciation, % | 0.32704 | 0.28226 | 0.72952 | 0.5538 | 0.22755 | 0.42404 | 0.42404 | 0.42404 | 0.42404 | 0.42404 |
| EBIT | -2,425.2 | -8,241.4 | -10,276.0 | 612.8 | 2,326.3 | -10,231.1 | -12,593.6 | -15,501.5 | -19,080.9 | -23,486.8 |
| EBIT, % | -4.8 | -15.86 | -51 | 2.02 | 3.69 | -13.19 | -13.19 | -13.19 | -13.19 | -13.19 |
| Total Cash | 2,198.2 | 4,575.1 | 479.0 | 3,026.5 | 7,109.5 | 5,707.1 | 7,024.9 | 8,647.0 | 10,643.6 | 13,101.3 |
| Total Cash, percent | .0 | .0 | .0 | .0 | .0 | .0 | .0 | .0 | .0 | .0 |
| Account Receivables | 26,438.0 | 23,164.7 | 24,799.6 | 32,452.4 | 12,558.5 | 49,159.0 | 60,510.2 | 74,482.3 | 91,680.8 | 112,850.4 |
| Account Receivables, % | 52.37 | 44.57 | 123.07 | 106.91 | 19.93 | 63.37 | 63.37 | 63.37 | 63.37 | 63.37 |
| Inventories | 2,201.1 | 1,109.0 | 515.1 | 670.6 | 26.1 | 1,753.2 | 2,158.1 | 2,656.4 | 3,269.7 | 4,024.7 |
| Inventories, % | 4.36 | 2.13 | 2.56 | 2.21 | 0.04141634 | 2.26 | 2.26 | 2.26 | 2.26 | 2.26 |
| Accounts Payable | 18,567.3 | 14,028.6 | 6,499.6 | 15,078.2 | 27,500.4 | 29,374.3 | 36,157.0 | 44,505.9 | 54,782.6 | 67,432.2 |
| Accounts Payable, % | 36.78 | 26.99 | 32.26 | 49.67 | 43.64 | 37.87 | 37.87 | 37.87 | 37.87 | 37.87 |
| Capital Expenditure | -164.5 | -132.3 | -92.4 | -10.1 | -43.5 | -177.1 | -217.9 | -268.3 | -330.2 | -406.5 |
| Capital Expenditure, % | -0.32586 | -0.25455 | -0.45856 | -0.03327425 | -0.06902724 | -0.22825 | -0.22825 | -0.22825 | -0.22825 | -0.22825 |
| Tax Rate, % | 49.89 | 49.89 | 49.89 | 49.89 | 49.89 | 49.89 | 49.89 | 49.89 | 49.89 | 49.89 |
| EBITAT | -2,035.4 | -8,235.1 | -10,195.9 | 753.6 | 1,165.7 | -8,863.8 | -10,910.6 | -13,429.9 | -16,530.9 | -20,348.0 |
| Depreciation | ||||||||||
| Changes in Account Receivables | ||||||||||
| Changes in Inventories | ||||||||||
| Changes in Accounts Payable | ||||||||||
| Capital Expenditure | ||||||||||
| UFCF | -12,106.6 | -8,394.0 | -18,711.3 | 1,681.9 | 34,226.2 | -45,165.7 | -15,696.9 | -19,321.4 | -23,782.8 | -29,274.4 |
| WACC, % | 6.48 | 6.77 | 6.75 | 6.77 | 5.87 | 6.53 | 6.53 | 6.53 | 6.53 | 6.53 |
| PV UFCF | ||||||||||
| SUM PV UFCF | -112,026.2 | |||||||||
| Long Term Growth Rate, % | 2.00 | |||||||||
| Free cash flow (T + 1) | -29,860 | |||||||||
| Terminal Value | -659,831 | |||||||||
| Present Terminal Value | -481,024 | |||||||||
| Enterprise Value | -593,050 | |||||||||
| Net Debt | 2,254 | |||||||||
| Equity Value | -595,304 | |||||||||
| Diluted Shares Outstanding, MM | 233 | |||||||||
| Equity Value Per Share | -2,550.78 |
What You Will Receive
- Customizable Excel Template: A versatile Excel-based DCF Calculator featuring pre-filled real SWSOLARNS financial data.
- Authentic Data: Access to historical data and future projections (highlighted in the yellow cells).
- Flexible Forecasting: Adjust key assumptions such as revenue growth, EBITDA %, and WACC as needed.
- Instant Calculations: Quickly observe how your inputs influence the valuation of Sterling and Wilson Renewable Energy Limited.
- Professional Resource: Designed for investors, CFOs, consultants, and finance professionals.
- User-Friendly Interface: Organized for simplicity and effectiveness, complete with step-by-step guidance.
Key Features
- Comprehensive DCF Calculator: Offers in-depth unlevered and levered DCF valuation models tailored for Sterling and Wilson Renewable Energy Limited (SWSOLARNS).
- WACC Calculator: Features a pre-configured Weighted Average Cost of Capital worksheet with adjustable input parameters.
- Customizable Forecast Assumptions: Easily alter growth projections, capital expenditures, and discount rates.
- Integrated Financial Ratios: Evaluate profitability, leverage, and efficiency ratios specifically for SWSOLARNS.
- Interactive Dashboard and Charts: Visual summaries present essential valuation metrics for straightforward analysis.
How It Functions
- Step 1: Download the Excel template for Sterling and Wilson Renewable Energy Limited (SWSOLARNS).
- Step 2: Examine the pre-populated financial information and projections for SWSOLARNS.
- Step 3: Adjust key variables such as revenue growth, WACC, and tax rates (highlighted cells).
- Step 4: Observe the DCF model refresh in real-time as you modify your assumptions.
- Step 5: Evaluate the outputs and apply the findings to make informed investment choices.
Reasons to Choose SWSOLARNS Calculator
- Precision: Utilizes authentic Sterling and Wilson financial data to guarantee accuracy.
- Adaptability: Created for users to effortlessly experiment with and adjust inputs.
- Efficiency: Eliminate the need to construct a DCF model from the ground up.
- High-Quality Standards: Crafted with the meticulousness and functionality expected at the CFO level.
- Intuitive Design: Simple to navigate, even for those lacking advanced financial modeling skills.
Who Should Use This Product?
- Institutional Investors: Create comprehensive and trustworthy valuation models for renewable energy portfolio assessments.
- Corporate Finance Departments: Evaluate valuation scenarios to inform strategic decisions within the company.
- Financial Consultants and Advisors: Deliver precise valuation insights for Sterling and Wilson Renewable Energy Limited (SWSOLARNS) to clients.
- Students and Instructors: Utilize real-world data to enhance learning and practice in financial modeling.
- Renewable Energy Enthusiasts: Gain insight into the valuation of companies like Sterling and Wilson Renewable Energy Limited (SWSOLARNS) in the market.
Contents of the Template
- Preloaded SWSOLARNS Data: Comprehensive historical and forecasted financial information, including revenue, EBIT, and capital expenditures.
- DCF and WACC Models: Advanced models designed for determining intrinsic value and Weighted Average Cost of Capital.
- Editable Inputs: Yellow-highlighted fields to modify projections for revenue growth, tax rates, and discount rates.
- Financial Statements: Detailed annual and quarterly financials for in-depth analysis.
- Key Ratios: Essential ratios for profitability, leverage, and efficiency assessment.
- Dashboard and Charts: Visual representations of valuation results and underlying assumptions.
Disclaimer
All information, articles, and product details provided on this website are for general informational and educational purposes only. We do not claim any ownership over, nor do we intend to infringe upon, any trademarks, copyrights, logos, brand names, or other intellectual property mentioned or depicted on this site. Such intellectual property remains the property of its respective owners, and any references here are made solely for identification or informational purposes, without implying any affiliation, endorsement, or partnership.
We make no representations or warranties, express or implied, regarding the accuracy, completeness, or suitability of any content or products presented. Nothing on this website should be construed as legal, tax, investment, financial, medical, or other professional advice. In addition, no part of this site—including articles or product references—constitutes a solicitation, recommendation, endorsement, advertisement, or offer to buy or sell any securities, franchises, or other financial instruments, particularly in jurisdictions where such activity would be unlawful.
All content is of a general nature and may not address the specific circumstances of any individual or entity. It is not a substitute for professional advice or services. Any actions you take based on the information provided here are strictly at your own risk. You accept full responsibility for any decisions or outcomes arising from your use of this website and agree to release us from any liability in connection with your use of, or reliance upon, the content or products found herein.