
|
Teradata Corporation (TDC) DCF Valuation |
Fully Editable: Tailor To Your Needs In Excel Or Sheets
Professional Design: Trusted, Industry-Standard Templates
Investor-Approved Valuation Models
MAC/PC Compatible, Fully Unlocked
No Expertise Is Needed; Easy To Follow
Teradata Corporation (TDC) Bundle
Evaluate Teradata Corporation's (TDC) financial prospects like an expert! This (TDC) DCF Calculator provides you with pre-filled financial data and complete flexibility to modify revenue growth, WACC, margins, and other critical assumptions to align with your predictions.
What You Will Get
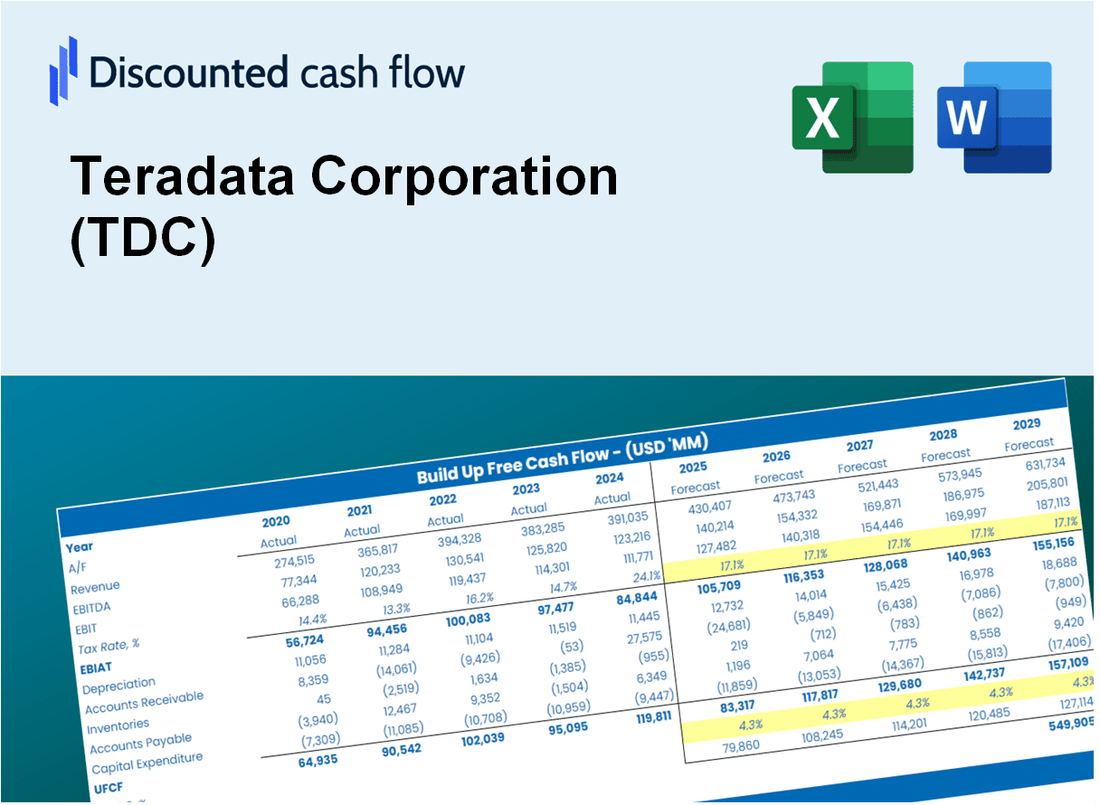
- Real Teradata Data: Preloaded financials – from revenue to EBIT – based on actual and projected figures for Teradata Corporation (TDC).
- Full Customization: Adjust all critical parameters (yellow cells) like WACC, growth %, and tax rates specific to Teradata Corporation (TDC).
- Instant Valuation Updates: Automatic recalculations to analyze the impact of changes on Teradata Corporation (TDC)’s fair value.
- Versatile Excel Template: Tailored for quick edits, scenario testing, and detailed projections for Teradata Corporation (TDC).
- Time-Saving and Accurate: Skip building models from scratch while maintaining precision and flexibility for Teradata Corporation (TDC).
Key Features
- Customizable Forecast Inputs: Adjust essential parameters such as revenue growth, EBITDA %, and capital investments.
- Instant DCF Valuation: Quickly computes intrinsic value, NPV, and other financial metrics.
- High-Precision Accuracy: Leverages Teradata's real-world financial data for precise valuation results.
- Effortless Scenario Analysis: Easily evaluate various assumptions and analyze results side by side.
- Efficiency Booster: Streamline your workflow by avoiding the creation of intricate valuation models from the ground up.
How It Works
- Download the Template: Get instant access to the Excel-based TDC DCF Calculator.
- Input Your Assumptions: Adjust yellow-highlighted cells for growth rates, WACC, margins, and more.
- Instant Calculations: The model automatically updates Teradata’s intrinsic value.
- Test Scenarios: Simulate different assumptions to evaluate potential valuation changes.
- Analyze and Decide: Use the results to guide your investment or financial analysis.
Why Choose the Teradata Calculator?
- Accuracy: Utilizes real Teradata financials for precise data.
- Flexibility: Built for users to easily adjust and explore inputs.
- Time-Saving: Eliminate the need to create a DCF model from the ground up.
- Professional-Grade: Crafted with the expertise and usability expected by CFOs.
- User-Friendly: Intuitive interface suitable for all skill levels, including beginners in financial modeling.
Who Should Use This Product?
- Investors: Accurately assess Teradata Corporation's (TDC) fair value prior to making investment choices.
- CFOs: Utilize a professional-grade DCF model for comprehensive financial reporting and analysis.
- Consultants: Efficiently customize the template for client valuation reports.
- Entrepreneurs: Acquire insights into the financial modeling practices of leading corporations.
- Educators: Implement it as a teaching resource to illustrate valuation methodologies.
What the Template Contains
- Preloaded TDC Data: Historical and projected financial data, including revenue, EBIT, and capital expenditures.
- DCF and WACC Models: Professional-grade sheets for calculating intrinsic value and Weighted Average Cost of Capital.
- Editable Inputs: Yellow-highlighted cells for adjusting revenue growth, tax rates, and discount rates.
- Financial Statements: Comprehensive annual and quarterly financials for deeper analysis.
- Key Ratios: Profitability, leverage, and efficiency ratios to evaluate performance.
- Dashboard and Charts: Visual summaries of valuation outcomes and assumptions.
Disclaimer
All information, articles, and product details provided on this website are for general informational and educational purposes only. We do not claim any ownership over, nor do we intend to infringe upon, any trademarks, copyrights, logos, brand names, or other intellectual property mentioned or depicted on this site. Such intellectual property remains the property of its respective owners, and any references here are made solely for identification or informational purposes, without implying any affiliation, endorsement, or partnership.
We make no representations or warranties, express or implied, regarding the accuracy, completeness, or suitability of any content or products presented. Nothing on this website should be construed as legal, tax, investment, financial, medical, or other professional advice. In addition, no part of this site—including articles or product references—constitutes a solicitation, recommendation, endorsement, advertisement, or offer to buy or sell any securities, franchises, or other financial instruments, particularly in jurisdictions where such activity would be unlawful.
All content is of a general nature and may not address the specific circumstances of any individual or entity. It is not a substitute for professional advice or services. Any actions you take based on the information provided here are strictly at your own risk. You accept full responsibility for any decisions or outcomes arising from your use of this website and agree to release us from any liability in connection with your use of, or reliance upon, the content or products found herein.