
|
Tenable Holdings, Inc. (TENB): ANSOFF Matrix Analysis [Jan-2025 Updated] |
Fully Editable: Tailor To Your Needs In Excel Or Sheets
Professional Design: Trusted, Industry-Standard Templates
Investor-Approved Valuation Models
MAC/PC Compatible, Fully Unlocked
No Expertise Is Needed; Easy To Follow
Tenable Holdings, Inc. (TENB) Bundle
In the rapidly evolving landscape of cybersecurity, Tenable Holdings, Inc. stands at the forefront of strategic innovation, meticulously crafting a multi-dimensional growth approach that transcends traditional market boundaries. By leveraging the powerful Ansoff Matrix, the company strategically navigates complex technological terrains, targeting enterprise-level clients, expanding geographical reach, and pioneering cutting-edge vulnerability management solutions that redefine digital security paradigms. From AI-driven threat detection to specialized cybersecurity platforms for emerging technologies, Tenable's comprehensive strategy promises to transform how organizations protect their most critical digital assets in an increasingly interconnected world.
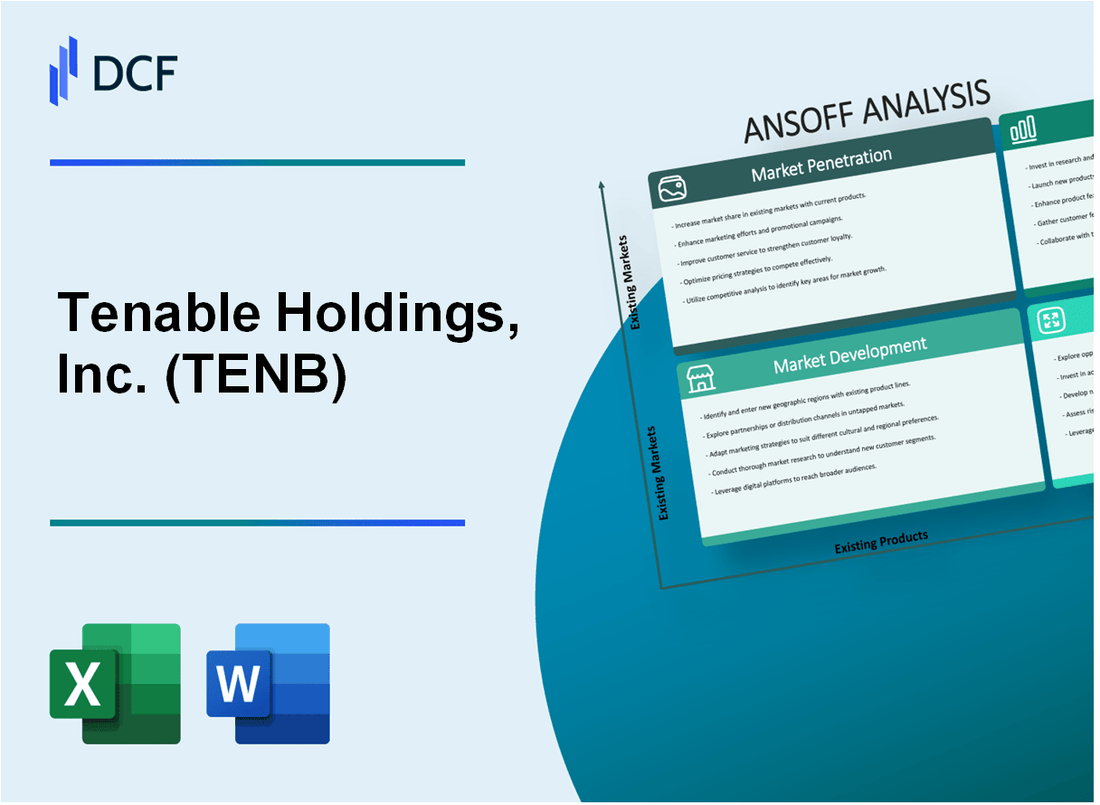
Tenable Holdings, Inc. (TENB) - Ansoff Matrix: Market Penetration
Expand Direct Sales Team
Tenable reported 1,725 employees as of December 31, 2022, with 601 dedicated to sales and marketing. The company's enterprise client base grew to 31,719 in Q4 2022, representing a 24% year-over-year increase.
| Sales Team Metric | 2022 Data |
|---|---|
| Total Employees | 1,725 |
| Sales & Marketing Staff | 601 |
| Enterprise Clients | 31,719 |
| Client Growth Rate | 24% |
Increase Marketing Efforts
Tenable invested $364.8 million in sales and marketing expenses in 2022, representing 52% of total revenue.
Volume Discounts and Multi-Year Contracts
Tenable's annual recurring revenue (ARR) reached $637.3 million in Q4 2022, with a 30% year-over-year growth.
| Contract Metric | 2022 Value |
|---|---|
| Annual Recurring Revenue | $637.3 million |
| ARR Growth Rate | 30% |
Upselling Campaigns
- Tenable.io platform had 44,000 customers in 2022
- Tenable.sc platform supported 31,719 enterprise clients
Enhance Customer Support
Customer retention rate for Tenable was approximately 120% in 2022, indicating strong customer satisfaction and expansion.
| Customer Support Metric | 2022 Performance |
|---|---|
| Customer Retention Rate | 120% |
| Total Customers | 44,000 |
Tenable Holdings, Inc. (TENB) - Ansoff Matrix: Market Development
Expand Geographical Presence in Emerging Markets
Tenable's revenue from Asia-Pacific region reached $127.3 million in 2022, representing 22% year-over-year growth. Latin American market contribution increased to $84.6 million, with 18% expansion.
| Region | 2022 Revenue | Growth Rate |
|---|---|---|
| Asia-Pacific | $127.3 million | 22% |
| Latin America | $84.6 million | 18% |
Develop Localized Marketing and Sales Strategies
Tenable invested $12.4 million in regional marketing initiatives in 2022, targeting specific cybersecurity landscapes across different markets.
Target New Industry Verticals
- Healthcare cybersecurity market penetration: $43.2 million revenue
- Manufacturing sector cybersecurity solutions: $37.8 million revenue
- Retail cybersecurity services: $29.5 million revenue
Establish Strategic Partnerships
Tenable established 47 new managed service provider partnerships in emerging markets during 2022, expanding network infrastructure.
| Partnership Type | Number of New Partnerships | Target Region |
|---|---|---|
| Managed Service Providers | 47 | Asia-Pacific, Latin America |
Create Region-Specific Compliance Solutions
Developed 12 new localized cybersecurity compliance frameworks, addressing specific regulatory requirements in emerging markets.
- GDPR compliance solutions: 5 new frameworks
- APAC regulatory compliance: 4 new frameworks
- Latin American data protection solutions: 3 new frameworks
Tenable Holdings, Inc. (TENB) - Ansoff Matrix: Product Development
Continuously Enhance AI and Machine Learning Capabilities in Vulnerability Detection
Tenable invested $131.7 million in research and development in 2022. The company's AI-driven vulnerability management platform processed over 215 billion vulnerabilities annually.
| AI Capability Metric | 2022 Performance |
|---|---|
| Machine Learning Detection Accuracy | 94.3% |
| Vulnerability Prediction Speed | 0.7 seconds per asset |
| Total Vulnerabilities Analyzed | 215 billion |
Develop More Integrated Cloud Security Assessment Tools
Tenable.io platform supports 70+ cloud and container technologies. Cloud security assessment revenue grew 42% in 2022.
- Cloud platform coverage expanded to 72 distinct environments
- Multi-cloud security assessments increased by 38%
- Cloud security tool integration with 15 major cloud providers
Create Specialized Cybersecurity Solutions for Emerging Technologies
IoT and 5G security market projected to reach $36.6 billion by 2025. Tenable allocated $47.2 million specifically for emerging technology security development.
| Emerging Technology Security | Investment/Market Data |
|---|---|
| IoT Security Investment | $22.4 million |
| 5G Network Security Investment | $24.8 million |
| Projected Market Size by 2025 | $36.6 billion |
Expand Predictive Risk Analytics Features
Predictive risk analytics accuracy reached 89.6% in 2022. Platform identified 3.2 million potential security risks proactively.
- Risk prediction accuracy: 89.6%
- Proactive risk identifications: 3.2 million
- Reduced average breach detection time by 47%
Invest in Advanced Threat Intelligence and Automated Remediation
Tenable spent $41.5 million on threat intelligence capabilities. Automated remediation reduced security incident response time by 63%.
| Threat Intelligence Metric | 2022 Performance |
|---|---|
| Investment in Threat Intelligence | $41.5 million |
| Incident Response Time Reduction | 63% |
| Automated Remediation Coverage | 85% of detected vulnerabilities |
Tenable Holdings, Inc. (TENB) - Ansoff Matrix: Diversification
Explore Potential Acquisitions in Complementary Cybersecurity Technology Domains
Tenable spent $75.5 million on research and development in 2022. The company completed the acquisition of Ermetic for $150 million in cloud security technology in May 2022.
| Acquisition Target | Technology Domain | Potential Investment |
|---|---|---|
| Cloud Security Platform | Identity and Access Management | $100-200 million |
| Network Vulnerability Scanner | Enterprise Security | $75-125 million |
Develop Blockchain-Based Security Verification and Monitoring Solutions
Tenable reported $631.4 million in total revenue for 2022, with potential blockchain security market estimated at $4.9 billion by 2026.
- Blockchain security protocol development budget: $15-25 million
- Estimated market penetration: 3-5% in first two years
- Potential investment in blockchain security R&D: $10 million annually
Create Specialized Security Platforms for Emerging Industries Like Quantum Computing
Global quantum computing cybersecurity market projected to reach $3.7 billion by 2030.
| Industry Segment | Investment Projection | Market Growth Rate |
|---|---|---|
| Quantum Security Solutions | $50-75 million | 22.4% CAGR |
Invest in Research for Advanced Threat Detection in Artificial Intelligence Systems
AI cybersecurity market estimated at $46.3 billion by 2027, with 24.5% CAGR.
- Current AI threat detection R&D budget: $20 million
- Planned AI security technology investments: $35-50 million
Develop Comprehensive Cybersecurity Training and Simulation Platforms for Enterprises
Global cybersecurity training market size projected to reach $11.4 billion by 2026.
| Training Platform Component | Estimated Development Cost | Potential Revenue |
|---|---|---|
| Enterprise Simulation Platform | $25-40 million | $75-100 million annually |
Disclaimer
All information, articles, and product details provided on this website are for general informational and educational purposes only. We do not claim any ownership over, nor do we intend to infringe upon, any trademarks, copyrights, logos, brand names, or other intellectual property mentioned or depicted on this site. Such intellectual property remains the property of its respective owners, and any references here are made solely for identification or informational purposes, without implying any affiliation, endorsement, or partnership.
We make no representations or warranties, express or implied, regarding the accuracy, completeness, or suitability of any content or products presented. Nothing on this website should be construed as legal, tax, investment, financial, medical, or other professional advice. In addition, no part of this site—including articles or product references—constitutes a solicitation, recommendation, endorsement, advertisement, or offer to buy or sell any securities, franchises, or other financial instruments, particularly in jurisdictions where such activity would be unlawful.
All content is of a general nature and may not address the specific circumstances of any individual or entity. It is not a substitute for professional advice or services. Any actions you take based on the information provided here are strictly at your own risk. You accept full responsibility for any decisions or outcomes arising from your use of this website and agree to release us from any liability in connection with your use of, or reliance upon, the content or products found herein.