
|
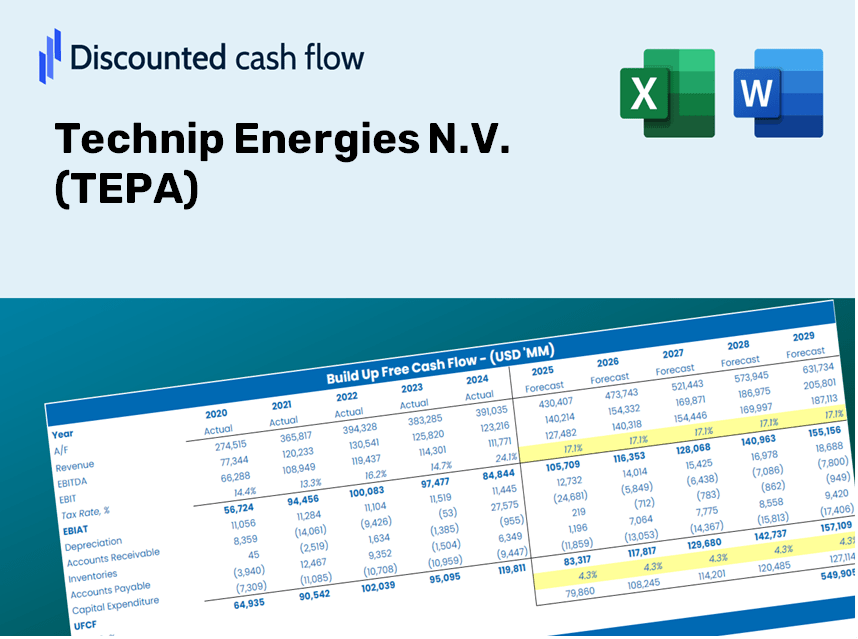
Technip Energies N.V. (TE.PA) DCF Valuation |
Fully Editable: Tailor To Your Needs In Excel Or Sheets
Professional Design: Trusted, Industry-Standard Templates
Investor-Approved Valuation Models
MAC/PC Compatible, Fully Unlocked
No Expertise Is Needed; Easy To Follow
Technip Energies N.V. (TE.PA) Bundle
Whether you’re an investor or analyst, this (TEPA) DCF Calculator is your go-to resource for accurate valuation. Loaded with real data from Technip Energies N.V., you can adjust forecasts and observe the effects in real-time.
What You Will Receive
- Genuine TEPA Financial Data: Pre-populated with Technip Energies’ historical and forecasted figures for accurate analysis.
- Completely Customizable Template: Easily adjust key metrics such as revenue growth, WACC, and EBITDA percentage.
- Instant Calculations: Observe updates to Technip Energies’ intrinsic value in real-time as you make alterations.
- Professional Valuation Instrument: Tailored for investors, analysts, and consultants seeking reliable DCF outcomes.
- Intuitive User Interface: A straightforward layout and clear guidance suitable for all skill levels.
Key Features
- Comprehensive DCF Calculator: Features detailed unlevered and levered DCF valuation frameworks tailored for Technip Energies N.V. (TEPA).
- WACC Calculator: Comes equipped with a pre-structured Weighted Average Cost of Capital sheet that allows for customizable input parameters.
- Customizable Forecast Assumptions: Adjust growth rates, capital expenditures, and discount rates according to your analysis needs.
- Integrated Financial Ratios: Evaluate profitability, leverage, and efficiency ratios specifically for Technip Energies N.V. (TEPA).
- Interactive Dashboard and Charts: Visual representations highlight essential valuation metrics, simplifying data interpretation.
How It Functions
- Download: Obtain the ready-to-use Excel file containing Technip Energies N.V. ([TEPA]) financial data.
- Customize: Modify forecasts such as revenue growth, EBITDA %, and WACC to fit your analysis.
- Update Automatically: Experience real-time updates on intrinsic value and NPV calculations.
- Test Scenarios: Generate various projections and instantly compare different outcomes.
- Make Decisions: Leverage the valuation results to inform your investment strategies.
Why Opt for This Calculator?
- All-in-One Solution: Combines DCF, WACC, and financial ratio analyses specifically for Technip Energies N.V. (TEPA).
- Flexible Inputs: Modify the yellow-highlighted cells to explore a variety of scenarios.
- In-Depth Analysis: Automatically computes Technip Energies' intrinsic value and Net Present Value.
- Data Ready: Features historical and projected data for reliable benchmarks.
- Expert-Level Resource: Perfect for financial analysts, investors, and business consultants focusing on Technip Energies N.V. (TEPA).
Who Can Benefit from This Product?
- Investors: Assess Technip Energies N.V. (TEPA)'s valuation prior to making stock trades.
- CFOs and Financial Analysts: Enhance valuation workflows and evaluate financial projections.
- Startup Founders: Understand the valuation methods used for prominent public companies like Technip Energies N.V. (TEPA).
- Consultants: Create comprehensive valuation reports for your clients.
- Students and Educators: Utilize current data to practice and teach valuation methodologies.
Contents of the Template
- Historical Data: Contains Technip Energies N.V. (TEPA)'s previous financials and foundational forecasts.
- DCF and Levered DCF Models: Comprehensive templates for calculating the intrinsic value of Technip Energies N.V. (TEPA).
- WACC Sheet: Preconfigured calculations for the Weighted Average Cost of Capital.
- Editable Inputs: Adjust essential drivers such as growth rates, EBITDA percentages, and CAPEX assumptions.
- Quarterly and Annual Statements: An extensive overview of Technip Energies N.V. (TEPA)'s financial performance.
- Interactive Dashboard: Dynamically visualize valuation results and future projections.
Disclaimer
All information, articles, and product details provided on this website are for general informational and educational purposes only. We do not claim any ownership over, nor do we intend to infringe upon, any trademarks, copyrights, logos, brand names, or other intellectual property mentioned or depicted on this site. Such intellectual property remains the property of its respective owners, and any references here are made solely for identification or informational purposes, without implying any affiliation, endorsement, or partnership.
We make no representations or warranties, express or implied, regarding the accuracy, completeness, or suitability of any content or products presented. Nothing on this website should be construed as legal, tax, investment, financial, medical, or other professional advice. In addition, no part of this site—including articles or product references—constitutes a solicitation, recommendation, endorsement, advertisement, or offer to buy or sell any securities, franchises, or other financial instruments, particularly in jurisdictions where such activity would be unlawful.
All content is of a general nature and may not address the specific circumstances of any individual or entity. It is not a substitute for professional advice or services. Any actions you take based on the information provided here are strictly at your own risk. You accept full responsibility for any decisions or outcomes arising from your use of this website and agree to release us from any liability in connection with your use of, or reliance upon, the content or products found herein.