
|
Tessenderlo Group NV (TESB.BR): SWOT Analysis |
Fully Editable: Tailor To Your Needs In Excel Or Sheets
Professional Design: Trusted, Industry-Standard Templates
Investor-Approved Valuation Models
MAC/PC Compatible, Fully Unlocked
No Expertise Is Needed; Easy To Follow
Tessenderlo Group NV (TESB.BR) Bundle
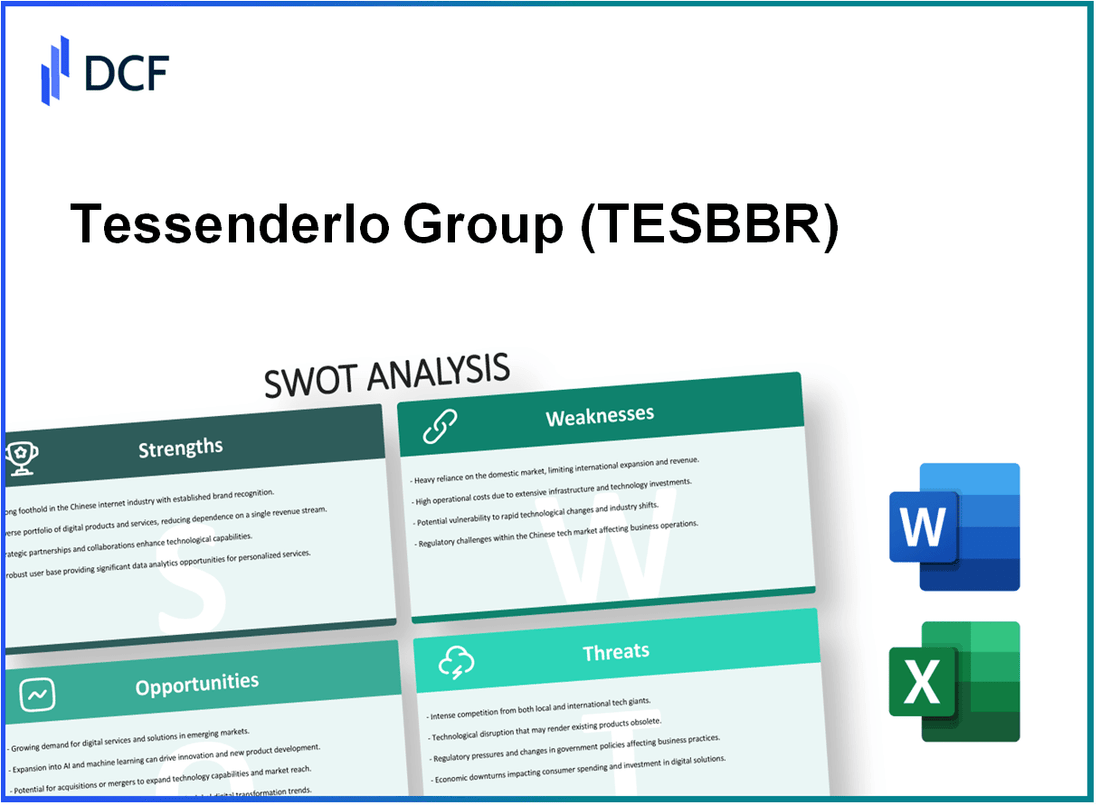
The Tessenderlo Group NV stands at a pivotal juncture in its journey, where understanding its strengths, weaknesses, opportunities, and threats (SWOT) can illuminate the path ahead. With a diverse portfolio and global reach, the company boasts impressive capabilities, yet faces challenges that require strategic finesse. Dive deeper into this comprehensive SWOT analysis to uncover how Tessenderlo can leverage its position and navigate the complexities of the market.
Tessenderlo Group NV - SWOT Analysis: Strengths
Tessenderlo Group NV boasts a diversified product portfolio spanning multiple industries, including agriculture, water treatment, and industrial applications. This diversification allows the company to mitigate risks associated with market fluctuations. The Group operates through several divisions such as Bio-valorization, Water Treatment, and Specialty Products, which collectively contribute to a balanced revenue stream.
According to the latest financial reports, Tessenderlo Group reported revenues of approximately €1.5 billion in 2022, reflecting a robust performance across its varied segments.
- The Bio-valorization division generated revenue of about €670 million.
- The Water Treatment division brought in approximately €300 million.
- The Specialty Products division accounted for around €530 million.
With a strong global presence, Tessenderlo Group operates in over 30 countries across Europe, North America, and Asia. The company's extensive distribution network is critical for reaching diverse markets and optimizing supply chain efficiency.
In terms of research and development capabilities, the company has invested roughly €40 million annually to enhance its innovation process. This commitment to R&D has resulted in numerous patented technologies and environmentally friendly processes, creating a competitive edge in the marketplace.
Regarding financial performance, Tessenderlo Group has demonstrated consistent revenue growth. From 2020 to 2022, the company achieved a CAGR (Compound Annual Growth Rate) of approximately 6% in its revenue. The following table illustrates key financial metrics over the past three years:
| Year | Revenue (€ million) | Net Income (€ million) | EBITDA (€ million) |
|---|---|---|---|
| 2020 | 1,300 | 70 | 180 |
| 2021 | 1,400 | 80 | 200 |
| 2022 | 1,500 | 90 | 220 |
Furthermore, the company enjoys a strong brand reputation and customer loyalty, largely attributed to its commitment to quality and sustainability. Customer surveys indicate a satisfaction rate exceeding 85% among its client base, reinforcing the Group's position as a trusted partner in various industries.
In summary, Tessenderlo Group NV's strengths lie in its diversified product offerings, expansive global operations, dedicated innovation strategies, impressive financial growth, and solid brand loyalty, all of which position it favorably in a competitive business landscape.
Tessenderlo Group NV - SWOT Analysis: Weaknesses
Tessenderlo Group NV faces several weaknesses that may impact its performance and market positioning.
High dependency on specific regions for revenue generation
The company generates a significant portion of its revenue from specific geographical areas. For instance, in 2022, approximately 65% of Tessenderlo's sales were derived from the European market, making it vulnerable to any economic downturns in that region.
Limited market share in certain competitive segments
Tessenderlo operates in a highly competitive environment, particularly in the specialty chemicals sector. In 2023, the company held a market share of only 6% in the global specialty fertilizers market, which limits its ability to influence pricing and gain competitive advantages.
Potential operational inefficiencies in some production facilities
Operational inefficiencies have been noted in some production units. For example, the company's production facilities in Belgium reported a lower than average output of 75% capacity utilization in 2022, which is below the industry standard of 85%.
Exposure to raw material price volatility
Tessenderlo's profitability is significantly affected by fluctuations in raw material prices. In 2022, the cost of raw materials surged by 20%, directly impacting the company's cost structure and reducing margins. This volatility is particularly evident in the production of its fertilizers, which relies heavily on natural gas prices.
| Weakness | Details | Statistical Impact |
|---|---|---|
| High Dependency on Regions | 65% sales from Europe | Vulnerability to regional economic downturns |
| Limited Market Share | 6% market share in specialty fertilizers | Less pricing power |
| Operational Inefficiencies | 75% capacity utilization in Belgium | Below industry standard of 85% |
| Price Volatility of Raw Materials | 20% increase in raw material costs in 2022 | Pressure on profit margins |
Tessenderlo Group NV - SWOT Analysis: Opportunities
Tessenderlo Group NV has several opportunities for growth and expansion in the current market landscape.
Expansion into Emerging Markets to Increase Market Share
The Tessenderlo Group has identified significant potential in emerging markets, particularly in regions like Asia-Pacific and Latin America. In 2022, the global chemical market in Asia-Pacific was valued at approximately USD 1.3 trillion and is projected to grow at a compound annual growth rate (CAGR) of 5.3% through 2025. This expansion is critical for tessenderlo as they aim to increase their market share in these regions.
Growth Potential in Sustainable and Environmentally Friendly Products
The demand for sustainable and environmentally friendly products is rapidly increasing. The global green chemicals market was valued at around USD 720 billion in 2022, with expectations to grow at a CAGR of 10.3% from 2023 to 2030. Tessenderlo has developed innovative solutions in this space, including bio-based fertilizers and biodegradable plastics, aligning with these market trends.
Strategic Acquisitions to Enhance Capabilities and Market Presence
Strategic acquisitions can bolster Tessenderlo’s capabilities and expand its market presence. In 2021, the company made a significant acquisition of 25% in a joint venture with Suez for its water treatment business. This move enhanced their service offerings and solidified their position in environmental services, projected to grow to USD 490 billion by 2025.
Increased Demand for Agricultural Products and Services
The agricultural sector is seeing a robust demand due to global population growth and food security concerns. The global agricultural market was valued at USD 9.5 trillion in 2022, with an expected CAGR of 3.4% through 2027. Tessenderlo’s focus on specialized fertilizers and crop protection solutions positions the company to capitalize on this growth.
| Opportunity | Market Size (2023) | CAGR (2023-2025) | Comments |
|---|---|---|---|
| Emerging Markets Expansion | USD 1.3 Trillion | 5.3% | Focus on Asia-Pacific and Latin America for growth. |
| Sustainable Products | USD 720 Billion | 10.3% | Increased demand for green chemicals and biodegradable solutions. |
| Strategic Acquisitions | USD 490 Billion | N/A | Partnership with Suez enhances environmental services. |
| Agricultural Products | USD 9.5 Trillion | 3.4% | Growing demand for fertilizers and crop protection solutions. |
Tessenderlo Group NV - SWOT Analysis: Threats
Intense competition in the chemical and plastics industry poses significant threats to Tessenderlo Group NV. The company faces competition from larger players such as BASF, Dow Chemical, and Lanxess, which collectively hold a substantial market share. For instance, BASF reported sales of approximately €78.6 billion in 2022, highlighting the scale at which competitors operate.
Regulatory challenges across different countries can also affect Tessenderlo's operations. New environmental legislation and compliance requirements, particularly within the EU, may lead to increased operational costs. According to the European Chemical Industry Council, the industry spends an estimated €11 billion annually on compliance with regulations, impacting profit margins.
Economic fluctuations are another concern, as they can significantly impact customer spending and demand for Tessenderlo’s products. The European economy has shown signs of volatility, with the European Central Bank reporting inflation rates climbing to 5.3% in 2023. High inflation can lead to decreased consumer spending, affecting sales across various segments.
The potential for supply chain disruptions also threatens product availability. The COVID-19 pandemic highlighted vulnerabilities within global supply chains, causing delays and increased costs. According to a survey by the Institute for Supply Management, about 75% of companies reported supply chain issues in 2022. Additionally, rising freight costs, which increased by an average of 50% from 2020 to 2022, further strain operational efficiency.
| Threat Type | Impact | Statistics/Data |
|---|---|---|
| Intense Competition | High | BASF sales: €78.6 billion (2022) |
| Regulatory Challenges | Medium | Compliance costs: €11 billion annually (EU) |
| Economic Fluctuations | Medium to High | Inflation Rate: 5.3% (2023) |
| Supply Chain Disruptions | High | 75% of companies report issues; Freight costs increased by 50% (2020-2022) |
The SWOT analysis of Tessenderlo Group NV highlights key factors shaping its business landscape, from its diverse product range and strong global presence to challenges like regional dependency and market competition. By leveraging its strengths and seizing growth opportunities, the company can strategically navigate the complex landscape, aiming for continued success and innovation in an evolving market.
Disclaimer
All information, articles, and product details provided on this website are for general informational and educational purposes only. We do not claim any ownership over, nor do we intend to infringe upon, any trademarks, copyrights, logos, brand names, or other intellectual property mentioned or depicted on this site. Such intellectual property remains the property of its respective owners, and any references here are made solely for identification or informational purposes, without implying any affiliation, endorsement, or partnership.
We make no representations or warranties, express or implied, regarding the accuracy, completeness, or suitability of any content or products presented. Nothing on this website should be construed as legal, tax, investment, financial, medical, or other professional advice. In addition, no part of this site—including articles or product references—constitutes a solicitation, recommendation, endorsement, advertisement, or offer to buy or sell any securities, franchises, or other financial instruments, particularly in jurisdictions where such activity would be unlawful.
All content is of a general nature and may not address the specific circumstances of any individual or entity. It is not a substitute for professional advice or services. Any actions you take based on the information provided here are strictly at your own risk. You accept full responsibility for any decisions or outcomes arising from your use of this website and agree to release us from any liability in connection with your use of, or reliance upon, the content or products found herein.