
|
Terex Corporation (TEX): 5 FORCES Analysis [Nov-2025 Updated] |
Fully Editable: Tailor To Your Needs In Excel Or Sheets
Professional Design: Trusted, Industry-Standard Templates
Investor-Approved Valuation Models
MAC/PC Compatible, Fully Unlocked
No Expertise Is Needed; Easy To Follow
Terex Corporation (TEX) Bundle
You're trying to map out the competitive terrain for Terex Corporation as of late 2025, and frankly, the landscape is tight. We see suppliers gaining ground-commodity volatility plus expected tariffs could cost about $\mathbf{\$0.70}$ in EPS, giving them more say-while powerful customers, like major construction firms, flex their muscles, especially when segments face cyclical pressure, such as the $\mathbf{8.2\%}$ legacy revenue decline in Q3. Despite intense rivalry with global players where Terex Corporation only claims about $\mathbf{5.46\%}$ market share, high capital needs and brand loyalty act as solid entry barriers. Dive in below to see the precise balance of power across all five forces for Terex Corporation.
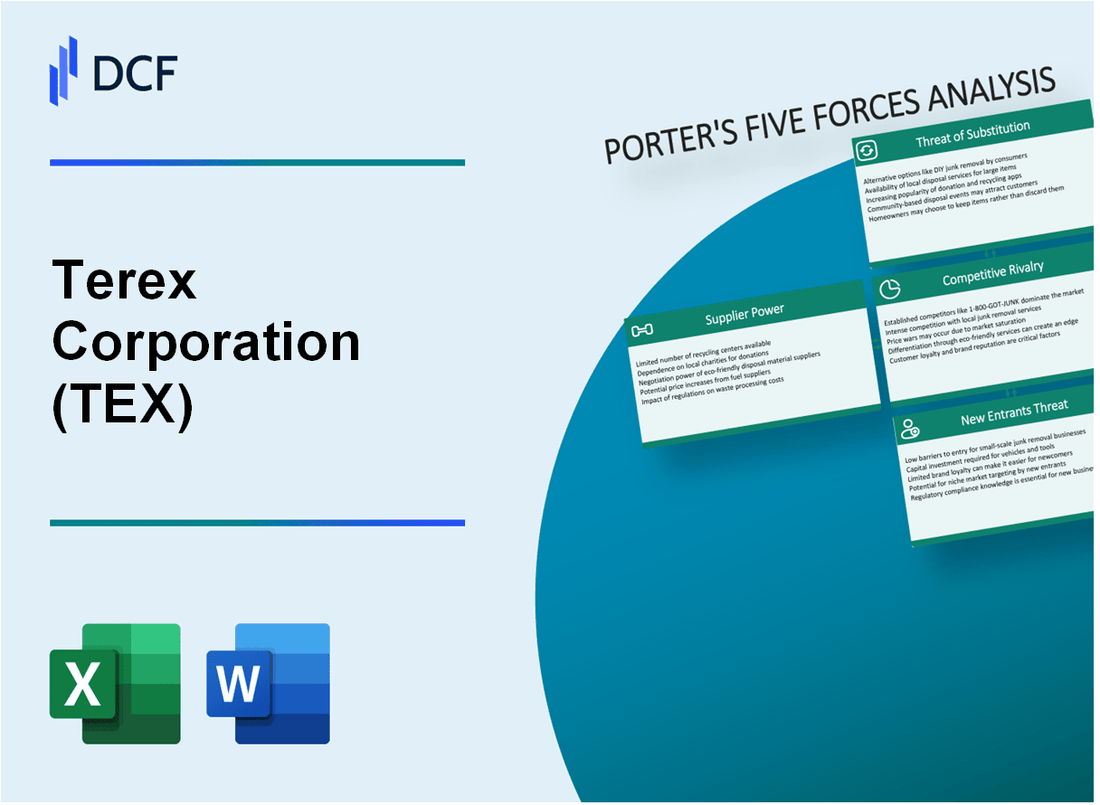
Terex Corporation (TEX) - Porter's Five Forces: Bargaining power of suppliers
Suppliers of core inputs like steel, castings, and engines for Terex Corporation hold a notable, though not overwhelming, level of bargaining power. This power stems significantly from the volatility inherent in commodity markets, which directly translates into fluctuating input costs for Terex. While the cost of U.S. steel declined throughout 2024, inflationary pressure on other purchased components has persisted across the supply chain. The principal materials and components Terex relies upon include steel, castings, engines, tires, hydraulics, cylinders, drive trains, and semiconductors.
The leverage held by these suppliers is demonstrably increased by ongoing supply chain disruptions and the direct financial burden of trade policy. For the full year 2025, Terex Corporation expects the net unfavorable impact of tariffs on its Earnings Per Share (EPS) to be approximately \$0.70. This tariff pressure is multifaceted; for instance, in Q2 2025, the impact was exacerbated by EU reciprocal tariffs rising from 10% to 15% and the doubling of Section 232 steel tariffs from 25% to 50%. These external cost pressures give suppliers more room to negotiate pricing upward, as Terex works to pass these costs on.
Terex Corporation actively works to counter this supplier leverage through strategic operational adjustments. The company has designed and implemented plans to mitigate these risks. These actions include:
- Using alternate suppliers.
- Expanding its supply base globally.
- Leveraging overall purchasing volumes for favorable pricing.
- Developing closer working relationships with key suppliers.
These mitigation strategies are crucial for maintaining margins, especially when pricing actions are considered a last resort. The company's liquidity, reported at \$1.3 billion as of September 30, 2025, provides a buffer to manage short-term cost spikes or secure favorable terms through advance purchasing.
Looking ahead, the structure of the component supply market suggests that supplier power could intensify. Consolidation among component suppliers, a risk already noted by Terex Corporation, naturally concentrates pricing power in fewer hands. If this trend continues, Terex will need to rely even more heavily on its global sourcing diversification and purchasing scale to avoid margin erosion from its suppliers.
Here is a snapshot of the key financial and operational data relevant to supplier power:
| Metric/Component | Data Point (Late 2025 Context) | Source of Pressure |
|---|---|---|
| Expected Full-Year Tariff Impact on EPS | \$0.70 | Increased input costs/Trade policy |
| EU Reciprocal Tariff Rate (Q2 2025 Peak) | 15% (up from 10%) | Increased cost of imported components |
| Section 232 Steel Tariff Rate (Q2 2025 Peak) | 50% (doubled from 25%) | Increased cost of raw materials |
| Key Purchased Materials | Steel, castings, engines, semiconductors | Commodity price volatility |
| Q3 2025 Liquidity | \$1.3 billion | Mitigation capacity |
The ability to maintain the full-year adjusted EPS outlook of \$4.70 to \$5.10 in the turbulent macro environment is directly tied to how effectively Terex manages these supplier dynamics.
Terex Corporation (TEX) - Porter's Five Forces: Bargaining power of customers
You're analyzing Terex Corporation's customer dynamics in late 2025, and the power held by buyers is a critical lever to watch, especially when end-markets soften. Honestly, the customer base for heavy equipment like that from Terex Corporation isn't fragmented; it's concentrated at the top end.
Consolidated Buyers and Market Weakness
Large rental fleet operators and major construction firms represent consolidated, powerful buyers. These entities purchase equipment in bulk, giving them significant leverage in price negotiations with Terex Corporation. When demand softens, this power amplifies because the volume of new orders is paramount to maintaining production schedules.
We saw this leverage play out as cyclical downturns in the Aerials and MP (Materials Processing) segments increased customer leverage. For instance, excluding the ESG acquisition contribution, Terex Corporation's legacy revenue declined by $\mathbf{8.2\%}$ year over year in the third quarter of 2025, driven by lower demand in those specific areas. When Terex Corporation has to reset production levels to match weak demand, customers know they have the upper hand.
Here's a quick look at how the core legacy segments performed in Q3 2025, illustrating the volume pressure:
| Segment | Q3 2025 Net Sales (Millions USD) | Q3 2025 Operating Margin (%) | Year-over-Year Sales Change Driver |
| Materials Processing (MP) | \$417 | 12.5 (Reported) / 12.4 (Adjusted) | Lower volume in North America concrete business |
| Aerial Work Platforms (AWP) | \$450 | 8.4 | Lower volume and unfavorable customer mix |
Mitigating Factors: Switching Costs and Support
Still, Terex Corporation has built in some friction to keep customers from jumping ship too easily. High switching costs due to specialized parts, digital solutions, and lifecycle support reduce customer power. Terex Corporation explicitly mentions providing best-in-class lifecycle support through its global parts and services organization, alongside complementary digital offerings. If a customer's fleet relies on Terex Corporation's proprietary diagnostic tools or specific parts availability, the cost of moving to a competitor-even for a better initial price-can be prohibitive.
The company's focus on essential services also shifts the dynamic. With nearly $\mathbf{60\%}$ of revenue tied to waste collection and emergency vehicles, these purchases are less subject to the economic ebb and flow that affects pure construction spending.
Price Sensitivity in Capital Spending
To be fair, customers remain highly price-sensitive given the capital expenditure nature of the equipment. Large asset purchases are scrutinized heavily against total cost of ownership. This sensitivity is evident when looking at the impact of external costs; management noted expecting higher tariff-related costs in the fourth quarter. Customers will push back on price increases stemming from these external pressures.
However, Terex Corporation's financial health provides some insulation, as its liquidity stood at $\mathbf{\$1.3}$ billion as of September 30, 2025. This financial footing allows the company to absorb some cost shocks or offer financing incentives, though the core negotiation remains price-driven.
Key customer-related financial metrics to monitor include:
- Legacy revenue decline in Q3 2025: 8.2%.
- Bookings growth in Q3 2025 (pro forma): 57% year over year.
- Book-to-bill ratio in Q3 2025: 72%.
- Share repurchase average price in Q3 2025: \$38.74 per share.
The balance here is between the high-volume, price-sensitive buyers and the sticky relationship built through long-term support contracts.
Finance: draft 13-week cash view by Friday.
Terex Corporation (TEX) - Porter's Five Forces: Competitive rivalry
You're looking at a tough field, and honestly, the competitive rivalry in the industrial equipment space for Terex Corporation is intense. It's not just a few local players; you're up against global heavyweights who command significant market percentages.
High rivalry exists with global giants like Caterpillar, JLG Industries, and Komatsu across segments. Caterpillar Inc., for instance, is the undisputed global leader, estimated to hold a $\mathbf{16.3\%}$ global market share by 2025. Komatsu Ltd. follows as the second-largest, with an estimated $\mathbf{10.7\%}$ share. Even Chinese manufacturers like XCMG Group are major forces, claiming an estimated $\mathbf{5.8\%}$ share. Terex Corporation is definitely fighting for position against these established behemoths.
The market is fragmented, with Terex holding an approximate $\mathbf{5.46\%}$ market share. To give you a clearer picture of where Terex stands against the top players in the broader construction equipment sector as of 2025, here's a quick comparison based on available estimates:
| Competitor | Estimated Global Market Share (2025) | Q3 2025 Net Sales (Terex Segment Comparison) |
|---|---|---|
| Caterpillar Inc. | 16.3% | N/A (Direct comparison not available) |
| Komatsu Ltd. | 10.7% | N/A (Direct comparison not available) |
| XCMG Group | 5.8% | N/A (Direct comparison not available) |
| Terex Corporation (Overall) | 5.46% (As specified) | $1.4 billion (Q3 2025 Net Sales) |
| Terex Aerials Segment (Q3 2025) | N/A | $537 million |
| Terex Materials Processing (MP) Segment (Q3 2025) | N/A | $417 million |
Competition centers on innovation, product reliability, and the push for electrification/hybrid models. Buyers are demanding smarter machines that deliver efficiency per gallon or kilowatt. This means Terex must keep pace with technological advancements that competitors are pushing:
- Automation, including auto-grade systems and 3D control in excavators.
- Increased focus on hybrid powertrains and Stage V compliance.
- Integration of telematics for maintenance alerts and payload measurement.
Still, Terex Corporation has a strategic countermeasure. Diversification into Environmental Solutions (ES) provides a less cyclical revenue stream, reducing overall rivalry impact. This segment is performing strongly, which helps buffer the cyclical nature of the core Aerials and Materials Processing (MP) businesses. For example, in Q3 2025, the ES segment posted net sales of $\mathbf{\$435 \text{ million}}$, growing $\mathbf{13.6\%}$ on a pro forma basis year-over-year. That segment even delivered an adjusted operating profit margin of $\mathbf{18.3\%}$ in the same quarter. This strategic move, solidified by the $\mathbf{\$2.0 \text{ billion}}$ acquisition of Environmental Solutions Group (ESG) in late 2024, was expected to be double-digit percentage adjusted EPS accretive in 2025. The ES business itself has a track record of resilient growth, showing a $\mathbf{7\%+}$ long-term organic revenue CAGR.
Finance: review the Q4 2025 segment margin projections against the full-year adjusted operating margin target of approximately $\mathbf{12\%}$.
Terex Corporation (TEX) - Porter's Five Forces: Threat of substitutes
You're looking at the competitive landscape for Terex Corporation as of late 2025, specifically how easily customers can switch to a different type of product or service to meet the same need. Honestly, for much of Terex Corporation's portfolio, the threat of direct substitution is lower than you might initially think, but it exists in specific pockets.
Moderate threat exists from non-specialized alternatives like scaffolding for basic access tasks. While Terex Corporation's Aerials segment, which is slated for exit via merger/spinoff, competes in the global Aerial Work Platform (AWP) market projected to be worth $20.61 billion in 2025, basic, low-height access can sometimes be achieved with simpler means. For instance, boom lifts, a key AWP category where Genie competes, held 43.25% of the 2024 revenue share, but for simple, short-duration tasks, non-specialized scaffolding or ladders might be chosen, especially in smaller construction or maintenance jobs where the capital outlay or rental cost of a full AWP isn't justified. Still, the industry trend favors powered access for safety, which limits this substitution.
For Materials Processing (MP), outsourcing or utilizing fixed plant operations can substitute mobile equipment. Terex Corporation's MP segment posted net sales of $417 million in the third quarter of 2025. The global Materials Processing Equipment Market is expected to reach $30.586 billion by the end of 2025. When a quarry or recycling operation needs to process material, they have a choice: buy a Terex Corporation mobile crusher/screen, rent one, or contract the entire crushing/screening job to a third-party service provider that already owns the fixed or mobile plant. This outsourcing option acts as a substitute for the outright purchase or long-term rental of Terex Corporation's equipment, though the flexibility of owning a mobile unit often wins out for project-based work.
The high specialization of Genie aerials and ES refuse vehicles limits direct substitution. Genie products are engineered for specific, high-demand access envelopes, and the ES (Environmental Systems) refuse vehicles are built to meet stringent municipal specifications. For example, in the AWP space, the market shows a preference for specialized units; the segment above 100 ft is expected to grow at a 9.28% CAGR to 2030, showing demand for high-reach capability that simple alternatives cannot match. Similarly, ES refuse vehicles are designed around complex loading mechanisms and regulatory compliance, making a generic truck chassis a poor substitute for the integrated system.
Terex Corporation's focus on essential services (Utilities, Waste/Recycling) makes their equipment difficult to replace. The planned pro forma combined company, post-merger with REV Group and exit of Aerials, targets an estimated ~14% adjusted EBITDA margin on $5.8 billion of projected revenue, suggesting a focus on more resilient end-markets. Equipment used for utility line repair or municipal waste collection is mission-critical; if a utility truck or a refuse vehicle breaks down, the service stops immediately. This operational necessity means customers prioritize reliability and OEM support over finding a cheaper, non-specialized alternative, effectively raising the switching cost.
Here's a quick look at some of the relevant market context as of late 2025:
| Metric | Value (Latest Available) | Context/Segment |
| Terex Corporation Q3 2025 Net Sales | $1.4 billion | Total Company Performance |
| Terex Corporation Q3 2025 MP Net Sales | $417 million | Materials Processing Segment |
| Terex Corporation Q3 2025 Aerials Sales | $537 million | Aerials Segment Performance |
| Global AWP Market Size (2025 Estimate) | $20.61 billion | Context for Genie Brand |
| Global Materials Processing Equipment Market (2025 Estimate) | $30.586 billion | Context for MP Segment |
| North America MP Market Share (2025) | 27.40% | Geographic Context for MP |
| Combined Company Pro Forma Revenue (2025 Estimate) | $5.8 billion | Post-Merger Focus Area |
The threat of substitution is further moderated by technological shifts, which can sometimes create a new substitute, but often reinforce Terex Corporation's specialized position:
- Electric AWP models are forecast to grow at a 10.26% CAGR through 2030, representing a substitution within the AWP segment (fuel-powered to electric), not a substitution away from AWPs entirely.
- The logistics automation market, which relates to material handling, is expected to expand from $54.7 billion in 2023 to $148.4 billion by 2032, showing that automation is a substitute for manual labor, not Terex Corporation's core products.
- Terex Corporation's full-year 2025 net sales outlook is between $5.3 billion and $5.5 billion, indicating that, despite substitution pressures, the core demand for their specialized equipment remains strong enough to support this projection.
What this estimate hides is the specific competitive pressure from smaller, niche equipment manufacturers that might offer a more focused, lower-cost substitute for a single function within a broader Terex Corporation product line.
Terex Corporation (TEX) - Porter's Five Forces: Threat of new entrants
High capital requirements for manufacturing, R&D, and establishing global service networks create a strong barrier. New entrants face the necessity of matching Terex Corporation's scale of investment in physical assets and innovation. For instance, Terex Corporation's projected capital expenditures, net of proceeds from asset sales, for the full year 2025 were approximately $120 million. This commitment to capital investment is ongoing, with $36 million deployed in the first quarter of 2025 alone. Research and development costs, which are expensed as incurred for new product development, were $25 million for the latest twelve months ending June 30, 2025.
| Period Ended | Capital Expenditures (Net of Proceeds) | Reported Quarterly Deployment |
| Q1 2025 | ~$120 million (Annual Projection) | $36 million |
| Q2 2025 | ~$120 million (Annual Projection) | $24 million |
| Q3 2025 | ~$120 million (Annual Projection) | $24 million |
The sheer scale of the existing operation, reflected in a market capitalization of $3.00 billion as of November 26, 2025, and a global workforce of 11,400 employees, presents a significant hurdle for any startup to overcome quickly. You can't just start selling equipment at this level without massive upfront investment in infrastructure.
Established brand recognition and dealer networks are hard to replicate. Terex Corporation markets its products under well-known names that carry significant weight in the industry. These include:
- Genie
- Powerscreen
- Fuchs
- EvoQuip
- Cedarapids
The distribution backbone is extensive, relying on a global network of independent distributors and rental companies for its Aerial Work Platform and telehandler products, and a similar structure for Materials Processing equipment. Building that level of channel trust and reach takes decades.
Compliance with stringent safety, quality, and environmental (ESG) regulations is a major hurdle. Terex Corporation explicitly integrates its commitment to safety and accountability into its value system, 'The Terex Way'. Furthermore, the company has strategically expanded into the waste and recycling market with the Environmental Solutions Group (ESG) segment, requiring adherence to specific environmental performance standards for refuse collection bodies and recycling equipment. Navigating the patchwork of global safety certifications and environmental compliance for heavy machinery is a costly, specialized endeavor that new players must absorb immediately.
New entrants from low-cost regions (e.g., China) remain a persistent, though manageable, threat. While specific market share data for new entrants is not immediately available, Terex Corporation's outlook for 2025 explicitly notes the need to monitor the regulatory environment and international trade policies, with a focus on mitigating the impact of tariffs. This suggests that price competition from overseas manufacturers is a factor that management actively tracks as a potential source of competitive pressure, even if the established barriers to entry limit the scale of that threat in the near term.
Disclaimer
All information, articles, and product details provided on this website are for general informational and educational purposes only. We do not claim any ownership over, nor do we intend to infringe upon, any trademarks, copyrights, logos, brand names, or other intellectual property mentioned or depicted on this site. Such intellectual property remains the property of its respective owners, and any references here are made solely for identification or informational purposes, without implying any affiliation, endorsement, or partnership.
We make no representations or warranties, express or implied, regarding the accuracy, completeness, or suitability of any content or products presented. Nothing on this website should be construed as legal, tax, investment, financial, medical, or other professional advice. In addition, no part of this site—including articles or product references—constitutes a solicitation, recommendation, endorsement, advertisement, or offer to buy or sell any securities, franchises, or other financial instruments, particularly in jurisdictions where such activity would be unlawful.
All content is of a general nature and may not address the specific circumstances of any individual or entity. It is not a substitute for professional advice or services. Any actions you take based on the information provided here are strictly at your own risk. You accept full responsibility for any decisions or outcomes arising from your use of this website and agree to release us from any liability in connection with your use of, or reliance upon, the content or products found herein.