
|
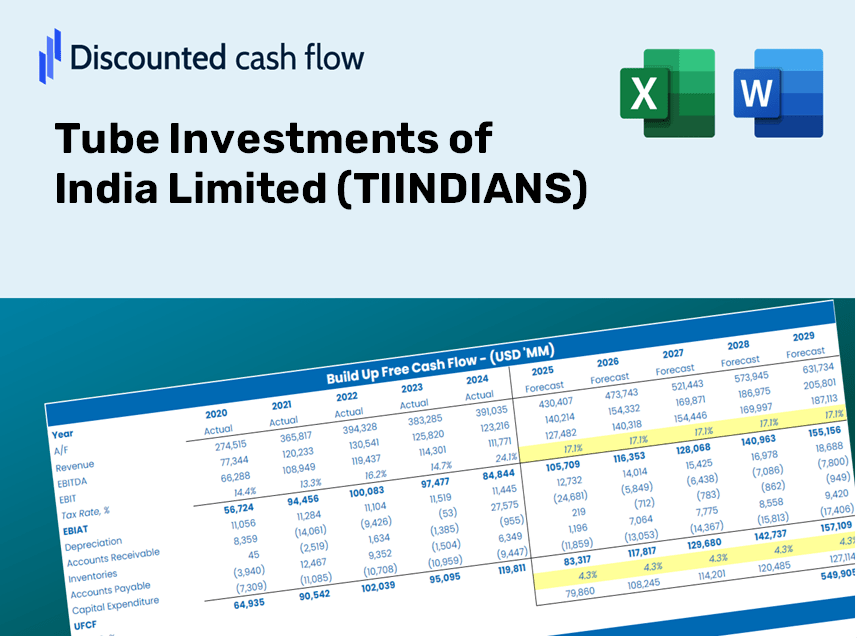
Tube Investments of India Limited (TIINDIA.NS) DCF Valuation |
Fully Editable: Tailor To Your Needs In Excel Or Sheets
Professional Design: Trusted, Industry-Standard Templates
Investor-Approved Valuation Models
MAC/PC Compatible, Fully Unlocked
No Expertise Is Needed; Easy To Follow
Tube Investments of India Limited (TIINDIA.NS) Bundle
Discover the true value of Tube Investments of India Limited (TIINDIANS) with our advanced DCF Calculator! Adjust key assumptions, explore various scenarios, and evaluate how changes affect Tube Investments of India Limited (TIINDIANS) valuation – all within a user-friendly Excel template.
Discounted Cash Flow (DCF) - (USD MM)
| Year | AY1 2021 |
AY2 2022 |
AY3 2023 |
AY4 2024 |
AY5 2025 |
FY1 2026 |
FY2 2027 |
FY3 2028 |
FY4 2029 |
FY5 2030 |
|---|---|---|---|---|---|---|---|---|---|---|
| Revenue | 58,378.3 | 119,955.6 | 144,377.9 | 163,423.5 | 189,216.4 | 259,857.4 | 356,871.1 | 490,103.5 | 673,076.0 | 924,358.5 |
| Revenue Growth, % | 0 | 105.48 | 20.36 | 13.19 | 15.78 | 37.33 | 37.33 | 37.33 | 37.33 | 37.33 |
| EBITDA | 6,279.5 | 14,435.1 | 18,826.8 | 19,238.2 | 19,297.4 | 30,039.9 | 41,254.9 | 56,656.7 | 77,808.7 | 106,857.3 |
| EBITDA, % | 10.76 | 12.03 | 13.04 | 11.77 | 10.2 | 11.56 | 11.56 | 11.56 | 11.56 | 11.56 |
| Depreciation | 2,288.2 | 3,232.9 | 3,740.1 | 3,861.8 | 4,057.6 | 7,126.7 | 9,787.3 | 13,441.3 | 18,459.3 | 25,350.8 |
| Depreciation, % | 3.92 | 2.7 | 2.59 | 2.36 | 2.14 | 2.74 | 2.74 | 2.74 | 2.74 | 2.74 |
| EBIT | 3,991.3 | 11,202.2 | 15,086.7 | 15,376.4 | 15,239.8 | 22,913.3 | 31,467.6 | 43,215.5 | 59,349.3 | 81,506.5 |
| EBIT, % | 6.84 | 9.34 | 10.45 | 9.41 | 8.05 | 8.82 | 8.82 | 8.82 | 8.82 | 8.82 |
| Total Cash | 9,379.1 | 7,676.5 | 18,031.1 | 26,432.1 | 29,350.8 | 34,633.8 | 47,563.9 | 65,321.1 | 89,707.7 | 123,198.7 |
| Total Cash, percent | .0 | .0 | .0 | .0 | .0 | .0 | .0 | .0 | .0 | .0 |
| Account Receivables | 12,388.5 | 20,169.0 | 22,834.4 | 28,789.1 | 33,053.0 | 46,220.9 | 63,476.8 | 87,174.8 | 119,720.2 | 164,415.9 |
| Account Receivables, % | 21.22 | 16.81 | 15.82 | 17.62 | 17.47 | 17.79 | 17.79 | 17.79 | 17.79 | 17.79 |
| Inventories | 11,093.6 | 13,271.1 | 13,529.1 | 17,875.2 | 22,237.8 | 32,288.6 | 44,343.0 | 60,897.8 | 83,633.0 | 114,856.1 |
| Inventories, % | 19 | 11.06 | 9.37 | 10.94 | 11.75 | 12.43 | 12.43 | 12.43 | 12.43 | 12.43 |
| Accounts Payable | 21,404.8 | 22,298.8 | 21,424.4 | 27,744.0 | 31,199.7 | 53,821.5 | 73,914.9 | 101,509.9 | 139,407.0 | 191,452.5 |
| Accounts Payable, % | 36.67 | 18.59 | 14.84 | 16.98 | 16.49 | 20.71 | 20.71 | 20.71 | 20.71 | 20.71 |
| Capital Expenditure | -1,503.6 | -2,480.8 | -4,160.1 | -8,513.9 | -12,129.5 | -9,950.0 | -13,664.7 | -18,766.3 | -25,772.4 | -35,394.1 |
| Capital Expenditure, % | -2.58 | -2.07 | -2.88 | -5.21 | -6.41 | -3.83 | -3.83 | -3.83 | -3.83 | -3.83 |
| Tax Rate, % | 59.25 | 59.25 | 59.25 | 59.25 | 59.25 | 59.25 | 59.25 | 59.25 | 59.25 | 59.25 |
| EBITAT | 3,014.0 | 7,632.3 | 9,118.4 | 10,942.9 | 6,210.5 | 14,481.4 | 19,887.8 | 27,312.6 | 37,509.4 | 51,512.9 |
| Depreciation | ||||||||||
| Changes in Account Receivables | ||||||||||
| Changes in Inventories | ||||||||||
| Changes in Accounts Payable | ||||||||||
| Capital Expenditure | ||||||||||
| UFCF | 1,721.3 | -679.6 | 4,900.6 | 2,309.6 | -7,032.2 | 11,061.2 | 6,793.5 | 9,329.8 | 12,812.9 | 17,596.4 |
| WACC, % | 4.59 | 4.58 | 4.56 | 4.58 | 4.53 | 4.57 | 4.57 | 4.57 | 4.57 | 4.57 |
| PV UFCF | ||||||||||
| SUM PV UFCF | 49,738.6 | |||||||||
| Long Term Growth Rate, % | 3.50 | |||||||||
| Free cash flow (T + 1) | 18,212 | |||||||||
| Terminal Value | 1,702,352 | |||||||||
| Present Terminal Value | 1,361,499 | |||||||||
| Enterprise Value | 1,411,237 | |||||||||
| Net Debt | 10,623 | |||||||||
| Equity Value | 1,400,615 | |||||||||
| Diluted Shares Outstanding, MM | 194 | |||||||||
| Equity Value Per Share | 7,234.77 |
Benefits You Will Receive
- Comprehensive Financial Model: Utilize TIINDIANS' actual data for accurate DCF valuation.
- Complete Forecast Flexibility: Modify revenue growth, profit margins, WACC, and other essential factors.
- Real-Time Calculations: Automatic updates provide immediate results as you make adjustments.
- Professional-Grade Template: A polished Excel file crafted for investor-ready valuation.
- Adaptable and Repeatable: Designed for versatility, enabling extensive use for thorough forecasts.
Key Features
- Pre-Configured Data: Tube Investments of India Limited's (TIINDIANS) historical financial statements and pre-filled projections.
- Customizable Inputs: Adjust WACC, tax rates, revenue growth, and EBITDA margins as needed.
- Real-Time Results: Observe the recalculation of intrinsic value for Tube Investments of India Limited (TIINDIANS) instantly.
- Intuitive Visual Displays: Dashboard visuals showcase valuation outcomes and essential metrics.
- Designed for Precision: A reliable resource for analysts, investors, and finance professionals.
How It Works
- 1. Access the Template: Download and open the Excel file containing Tube Investments of India Limited's (TIINDIANS) preloaded data.
- 2. Modify Assumptions: Adjust key inputs such as growth rates, WACC, and capital expenditures according to your analysis.
- 3. View Results in Real-Time: The DCF model automatically calculates the intrinsic value and NPV based on your inputs.
- 4. Explore Various Scenarios: Assess different forecasts to evaluate alternative valuation outcomes.
- 5. Present with Assurance: Share comprehensive valuation insights to support your strategic decisions.
Why Opt for This Calculator?
- Precision: Leveraging authentic Tube Investments financials for dependable data accuracy.
- Adaptability: Built for users to freely experiment with and adjust inputs.
- Efficiency: Eliminate the need to create a DCF model from the ground up.
- Professional Quality: Crafted with the expertise and usability expected at the CFO level.
- Accessible: Designed for simplicity, making it suitable for users with no advanced financial modeling skills.
Who Can Benefit from This Product?
- Investors: Evaluate the valuation of Tube Investments of India Limited (TIINDIANS) before making stock transactions.
- CFOs and Financial Analysts: Enhance valuation processes and analyze financial forecasts.
- Startup Founders: Understand how large public firms like Tube Investments of India Limited (TIINDIANS) are evaluated.
- Consultants: Create detailed valuation reports for clients utilizing real-time insights.
- Students and Educators: Utilize authentic data to practice and teach valuation methodologies.
What the Template Contains
- Operating and Balance Sheet Data: Pre-filled historical data and forecasts for Tube Investments of India Limited (TIINDIANS), including revenue, EBITDA, EBIT, and capital expenditures.
- WACC Calculation: A dedicated sheet for Weighted Average Cost of Capital (WACC), featuring parameters like Beta, risk-free rate, and share price.
- DCF Valuation (Unlevered and Levered): Customizable Discounted Cash Flow models illustrating intrinsic value with comprehensive calculations.
- Financial Statements: Pre-loaded annual and quarterly financial statements to facilitate thorough analysis.
- Key Ratios: Includes profitability, leverage, and efficiency ratios specific to Tube Investments of India Limited (TIINDIANS).
- Dashboard and Charts: A visual summary of valuation outputs and assumptions to streamline results analysis.
Disclaimer
All information, articles, and product details provided on this website are for general informational and educational purposes only. We do not claim any ownership over, nor do we intend to infringe upon, any trademarks, copyrights, logos, brand names, or other intellectual property mentioned or depicted on this site. Such intellectual property remains the property of its respective owners, and any references here are made solely for identification or informational purposes, without implying any affiliation, endorsement, or partnership.
We make no representations or warranties, express or implied, regarding the accuracy, completeness, or suitability of any content or products presented. Nothing on this website should be construed as legal, tax, investment, financial, medical, or other professional advice. In addition, no part of this site—including articles or product references—constitutes a solicitation, recommendation, endorsement, advertisement, or offer to buy or sell any securities, franchises, or other financial instruments, particularly in jurisdictions where such activity would be unlawful.
All content is of a general nature and may not address the specific circumstances of any individual or entity. It is not a substitute for professional advice or services. Any actions you take based on the information provided here are strictly at your own risk. You accept full responsibility for any decisions or outcomes arising from your use of this website and agree to release us from any liability in connection with your use of, or reliance upon, the content or products found herein.