
|
Interface, Inc. (TILE) DCF Valuation |
Fully Editable: Tailor To Your Needs In Excel Or Sheets
Professional Design: Trusted, Industry-Standard Templates
Investor-Approved Valuation Models
MAC/PC Compatible, Fully Unlocked
No Expertise Is Needed; Easy To Follow
Interface, Inc. (TILE) Bundle
Enhance your investment strategies with the Interface, Inc. (TILE) DCF Calculator! Utilize accurate financial data, adjust growth projections and expenses, and observe how these modifications affect the intrinsic value of Interface, Inc. (TILE) in real-time.
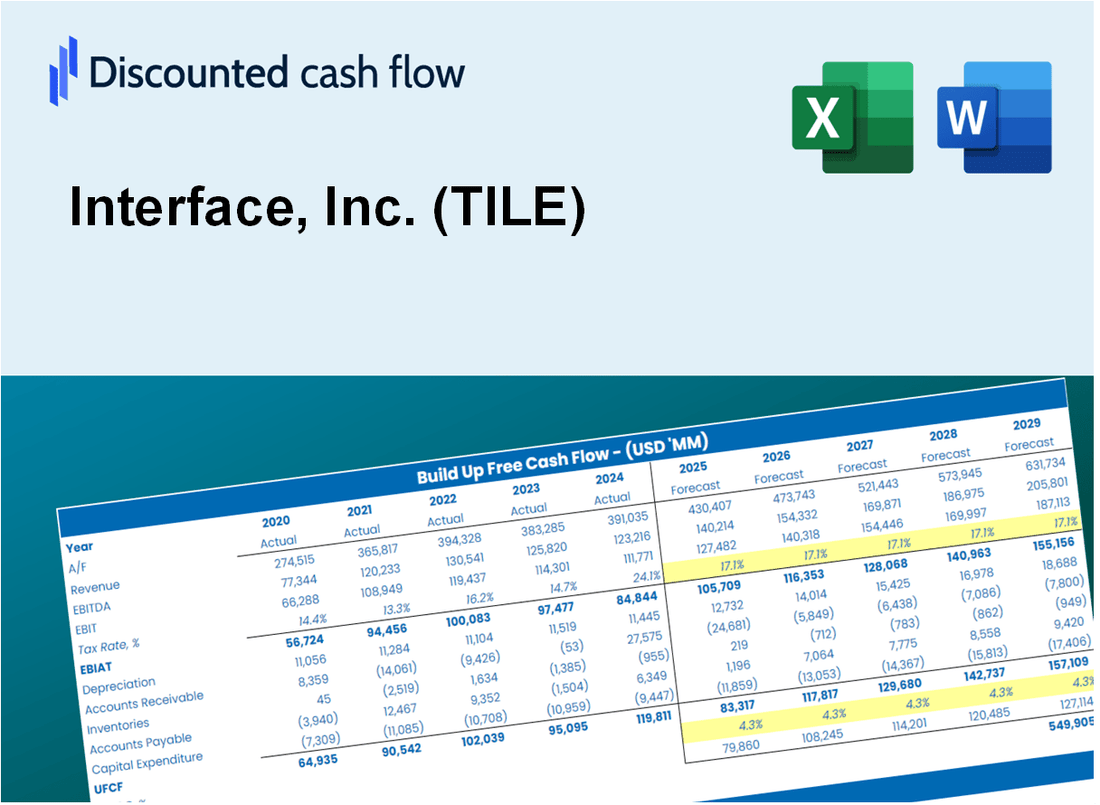
Discounted Cash Flow (DCF) - (USD MM)
| Year | AY1 2020 |
AY2 2021 |
AY3 2022 |
AY4 2023 |
AY5 2024 |
FY1 2025 |
FY2 2026 |
FY3 2027 |
FY4 2028 |
FY5 2029 |
|---|---|---|---|---|---|---|---|---|---|---|
| Revenue | 1,103.3 | 1,200.4 | 1,297.9 | 1,261.5 | 1,315.7 | 1,376.2 | 1,439.6 | 1,505.9 | 1,575.2 | 1,647.7 |
| Revenue Growth, % | 0 | 8.8 | 8.12 | -2.81 | 4.29 | 4.6 | 4.6 | 4.6 | 4.6 | 4.6 |
| EBITDA | 1.2 | 155.5 | 118.2 | 141.7 | 181.4 | 129.9 | 135.9 | 142.1 | 148.7 | 155.5 |
| EBITDA, % | 0.10886 | 12.95 | 9.11 | 11.23 | 13.79 | 9.44 | 9.44 | 9.44 | 9.44 | 9.44 |
| Depreciation | 51.4 | 53.1 | 46.3 | 46.3 | 44.7 | 54.3 | 56.8 | 59.4 | 62.1 | 65.0 |
| Depreciation, % | 4.66 | 4.43 | 3.57 | 3.67 | 3.4 | 3.94 | 3.94 | 3.94 | 3.94 | 3.94 |
| EBIT | -50.2 | 102.3 | 71.8 | 95.4 | 136.8 | 75.6 | 79.1 | 82.7 | 86.5 | 90.5 |
| EBIT, % | -4.55 | 8.52 | 5.54 | 7.57 | 10.39 | 5.49 | 5.49 | 5.49 | 5.49 | 5.49 |
| Total Cash | 103.1 | 97.3 | 97.6 | 110.5 | 99.2 | 113.6 | 118.8 | 124.3 | 130.0 | 136.0 |
| Total Cash, percent | .0 | .0 | .0 | .0 | .0 | .0 | .0 | .0 | .0 | .0 |
| Account Receivables | 139.9 | 171.7 | 182.8 | 163.4 | 171.1 | 184.5 | 193.0 | 201.9 | 211.1 | 220.9 |
| Account Receivables, % | 12.68 | 14.3 | 14.08 | 12.95 | 13.01 | 13.4 | 13.4 | 13.4 | 13.4 | 13.4 |
| Inventories | 228.7 | 265.1 | 306.3 | 279.1 | 260.6 | 298.2 | 311.9 | 326.3 | 341.3 | 357.0 |
| Inventories, % | 20.73 | 22.08 | 23.6 | 22.12 | 19.81 | 21.67 | 21.67 | 21.67 | 21.67 | 21.67 |
| Accounts Payable | 58.7 | 85.9 | 78.3 | 62.9 | 68.9 | 79.1 | 82.7 | 86.5 | 90.5 | 94.7 |
| Accounts Payable, % | 5.32 | 7.16 | 6.03 | 4.99 | 5.24 | 5.75 | 5.75 | 5.75 | 5.75 | 5.75 |
| Capital Expenditure | -62.9 | -28.1 | -18.4 | -26.1 | -33.8 | -38.8 | -40.6 | -42.5 | -44.4 | -46.5 |
| Capital Expenditure, % | -5.71 | -2.34 | -1.42 | -2.07 | -2.57 | -2.82 | -2.82 | -2.82 | -2.82 | -2.82 |
| Tax Rate, % | 23.43 | 23.43 | 23.43 | 23.43 | 23.43 | 23.43 | 23.43 | 23.43 | 23.43 | 23.43 |
| EBITAT | -45.4 | 77.8 | 33.5 | 66.7 | 104.7 | 54.4 | 56.9 | 59.5 | 62.3 | 65.1 |
| Depreciation | ||||||||||
| Changes in Account Receivables | ||||||||||
| Changes in Inventories | ||||||||||
| Changes in Accounts Payable | ||||||||||
| Capital Expenditure | ||||||||||
| UFCF | -366.9 | 61.9 | 1.4 | 118.2 | 132.4 | 29.0 | 54.5 | 57.0 | 59.6 | 62.4 |
| WACC, % | 11.83 | 11.66 | 11.32 | 11.59 | 11.67 | 11.61 | 11.61 | 11.61 | 11.61 | 11.61 |
| PV UFCF | ||||||||||
| SUM PV UFCF | 185.2 | |||||||||
| Long Term Growth Rate, % | 3.00 | |||||||||
| Free cash flow (T + 1) | 64 | |||||||||
| Terminal Value | 746 | |||||||||
| Present Terminal Value | 431 | |||||||||
| Enterprise Value | 616 | |||||||||
| Net Debt | 284 | |||||||||
| Equity Value | 332 | |||||||||
| Diluted Shares Outstanding, MM | 59 | |||||||||
| Equity Value Per Share | 5.64 |
What You Will Get
- Real TILE Financial Data: Pre-filled with Interface, Inc.'s historical and projected data for precise analysis.
- Fully Editable Template: Modify key inputs like revenue growth, WACC, and EBITDA % with ease.
- Automatic Calculations: See Interface, Inc.'s intrinsic value update instantly based on your changes.
- Professional Valuation Tool: Designed for investors, analysts, and consultants seeking accurate DCF results.
- User-Friendly Design: Simple structure and clear instructions for all experience levels.
Key Features
- Comprehensive TILE Data: Pre-filled with Interface, Inc.’s historical performance metrics and future forecasts.
- Flexible Input Options: Modify revenue growth, profit margins, discount rates, tax implications, and capital spending.
- Interactive Valuation Framework: Automatic recalculations of Net Present Value (NPV) and intrinsic value based on user-defined parameters.
- Scenario Analysis: Develop various forecasting scenarios to evaluate different valuation results.
- Intuitive User Interface: Designed to be straightforward and accessible for both seasoned professionals and newcomers.
How It Works
- Download: Obtain the pre-built Excel file containing Interface, Inc.'s (TILE) financial data.
- Customize: Modify forecasts such as revenue growth, EBITDA %, and WACC to fit your analysis.
- Update Automatically: Watch as the intrinsic value and NPV calculations refresh in real-time.
- Test Scenarios: Develop various projections and instantly evaluate different outcomes.
- Make Decisions: Leverage the valuation results to inform your investment approach.
Why Choose This Calculator?
- Accurate Data: Real Interface, Inc. (TILE) financials ensure reliable valuation results.
- Customizable: Adjust key parameters like growth rates, WACC, and tax rates to align with your projections.
- Time-Saving: Pre-built calculations remove the need to start from the ground up.
- Professional-Grade Tool: Tailored for investors, analysts, and consultants in the field.
- User-Friendly: Intuitive design and step-by-step guidance make it accessible for all users.
Who Should Use This Product?
- Individual Investors: Gain insights for making informed decisions about investing in Interface, Inc. (TILE).
- Financial Analysts: Enhance valuation efforts with comprehensive financial models tailored for Interface, Inc. (TILE).
- Consultants: Provide clients with accurate and timely valuation analysis of Interface, Inc. (TILE).
- Business Owners: Analyze the valuation strategies of industry leaders like Interface, Inc. (TILE) to inform your own business approach.
- Finance Students: Explore real-world valuation practices using data from Interface, Inc. (TILE) as a case study.
What the Template Contains
- Operating and Balance Sheet Data: Pre-filled Interface, Inc. (TILE) historical data and forecasts, including revenue, EBITDA, EBIT, and capital expenditures.
- WACC Calculation: A dedicated sheet for Weighted Average Cost of Capital (WACC), including parameters like Beta, risk-free rate, and share price.
- DCF Valuation (Unlevered and Levered): Editable Discounted Cash Flow models showing intrinsic value with detailed calculations.
- Financial Statements: Pre-loaded financial statements (annual and quarterly) to support analysis.
- Key Ratios: Includes profitability, leverage, and efficiency ratios for Interface, Inc. (TILE).
- Dashboard and Charts: Visual summary of valuation outputs and assumptions to analyze results easily.
Disclaimer
All information, articles, and product details provided on this website are for general informational and educational purposes only. We do not claim any ownership over, nor do we intend to infringe upon, any trademarks, copyrights, logos, brand names, or other intellectual property mentioned or depicted on this site. Such intellectual property remains the property of its respective owners, and any references here are made solely for identification or informational purposes, without implying any affiliation, endorsement, or partnership.
We make no representations or warranties, express or implied, regarding the accuracy, completeness, or suitability of any content or products presented. Nothing on this website should be construed as legal, tax, investment, financial, medical, or other professional advice. In addition, no part of this site—including articles or product references—constitutes a solicitation, recommendation, endorsement, advertisement, or offer to buy or sell any securities, franchises, or other financial instruments, particularly in jurisdictions where such activity would be unlawful.
All content is of a general nature and may not address the specific circumstances of any individual or entity. It is not a substitute for professional advice or services. Any actions you take based on the information provided here are strictly at your own risk. You accept full responsibility for any decisions or outcomes arising from your use of this website and agree to release us from any liability in connection with your use of, or reliance upon, the content or products found herein.