
|
Tivic Health Systems, Inc. (TIVC) DCF Valuation |
Fully Editable: Tailor To Your Needs In Excel Or Sheets
Professional Design: Trusted, Industry-Standard Templates
Investor-Approved Valuation Models
MAC/PC Compatible, Fully Unlocked
No Expertise Is Needed; Easy To Follow
Tivic Health Systems, Inc. (TIVC) Bundle
Designed for accuracy, our (TIVC) DCF Calculator empowers you to assess Tivic Health Systems, Inc. valuation using real-world financial data and offers complete flexibility to modify all essential parameters for enhanced projections.
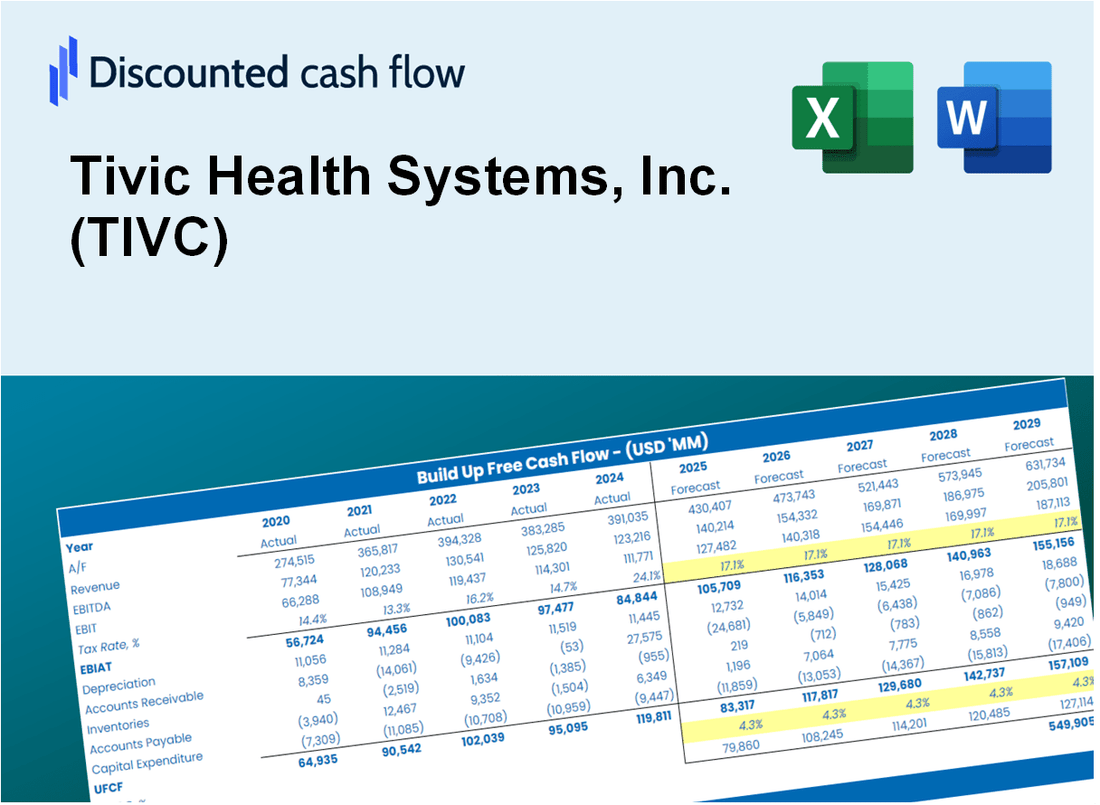
Discounted Cash Flow (DCF) - (USD MM)
| Year | AY1 2020 |
AY2 2021 |
AY3 2022 |
AY4 2023 |
AY5 2024 |
FY1 2025 |
FY2 2026 |
FY3 2027 |
FY4 2028 |
FY5 2029 |
|---|---|---|---|---|---|---|---|---|---|---|
| Revenue | .9 | 1.2 | 1.8 | 1.2 | .8 | .8 | .9 | .9 | 1.0 | 1.0 |
| Revenue Growth, % | 0 | 35.58 | 57.8 | -36.09 | -33.67 | 5.91 | 5.91 | 5.91 | 5.91 | 5.91 |
| EBITDA | -3.2 | -6.6 | -9.9 | -8.1 | -5.3 | -.8 | -.9 | -.9 | -1.0 | -1.0 |
| EBITDA, % | -373.02 | -570.07 | -539.35 | -685.54 | -680.64 | -100 | -100 | -100 | -100 | -100 |
| Depreciation | .0 | .0 | .2 | .2 | .4 | .1 | .1 | .1 | .1 | .2 |
| Depreciation, % | 0.93023 | 2.06 | 9.46 | 15.48 | 45.13 | 14.61 | 14.61 | 14.61 | 14.61 | 14.61 |
| EBIT | -3.2 | -6.7 | -10.1 | -8.2 | -5.7 | -.8 | -.9 | -.9 | -1.0 | -1.0 |
| EBIT, % | -373.95 | -572.13 | -548.8 | -701.02 | -725.77 | -100 | -100 | -100 | -100 | -100 |
| Total Cash | 1.0 | 13.0 | 3.5 | 3.4 | 2.0 | .8 | .9 | .9 | 1.0 | 1.0 |
| Total Cash, percent | .0 | .0 | .0 | .0 | .0 | .0 | .0 | .0 | .0 | .0 |
| Account Receivables | .1 | .1 | .1 | .2 | .1 | .1 | .1 | .1 | .1 | .1 |
| Account Receivables, % | 6.05 | 7.89 | 5.82 | 14.8 | 8.85 | 8.68 | 8.68 | 8.68 | 8.68 | 8.68 |
| Inventories | .2 | .4 | .9 | .8 | .3 | .4 | .4 | .4 | .4 | .5 |
| Inventories, % | 28.02 | 36.79 | 46.9 | 64.29 | 40.9 | 43.38 | 43.38 | 43.38 | 43.38 | 43.38 |
| Accounts Payable | .4 | .8 | 1.3 | .7 | .1 | .4 | .5 | .5 | .5 | .5 |
| Accounts Payable, % | 43.02 | 67.67 | 71.9 | 60.63 | 16.03 | 51.85 | 51.85 | 51.85 | 51.85 | 51.85 |
| Capital Expenditure | .0 | .0 | .0 | -.1 | .0 | .0 | .0 | .0 | .0 | .0 |
| Capital Expenditure, % | 0 | 0 | -0.59783 | -10.03 | 0 | -2.13 | -2.13 | -2.13 | -2.13 | -2.13 |
| Tax Rate, % | 0 | 0 | 0 | 0 | 0 | 0 | 0 | 0 | 0 | 0 |
| EBITAT | -3.6 | -6.7 | -10.1 | -8.2 | -5.7 | -.8 | -.9 | -.9 | -1.0 | -1.0 |
| Depreciation | ||||||||||
| Changes in Account Receivables | ||||||||||
| Changes in Inventories | ||||||||||
| Changes in Accounts Payable | ||||||||||
| Capital Expenditure | ||||||||||
| UFCF | -3.5 | -6.5 | -9.8 | -8.8 | -5.4 | -.5 | -.8 | -.8 | -.9 | -.9 |
| WACC, % | 13.01 | 13.01 | 13.01 | 13.01 | 13.01 | 13.01 | 13.01 | 13.01 | 13.01 | 13.01 |
| PV UFCF | ||||||||||
| SUM PV UFCF | -2.6 | |||||||||
| Long Term Growth Rate, % | 2.00 | |||||||||
| Free cash flow (T + 1) | -1 | |||||||||
| Terminal Value | -8 | |||||||||
| Present Terminal Value | -5 | |||||||||
| Enterprise Value | -7 | |||||||||
| Net Debt | -2 | |||||||||
| Equity Value | -5 | |||||||||
| Diluted Shares Outstanding, MM | 287 | |||||||||
| Equity Value Per Share | -0.02 |
What You Will Get
- Editable Forecast Inputs: Effortlessly adjust key assumptions (growth %, margins, WACC) to explore various scenarios.
- Real-World Data: Tivic Health Systems, Inc.'s (TIVC) financial data pre-loaded to enhance your analysis.
- Automatic DCF Outputs: The template computes Net Present Value (NPV) and intrinsic value automatically.
- Customizable and Professional: A sleek Excel model tailored to meet your valuation requirements.
- Built for Analysts and Investors: Perfect for evaluating projections, validating strategies, and optimizing your time.
Key Features
- 🔍 Real-Life TIVC Financials: Pre-filled historical and projected data for Tivic Health Systems, Inc.
- ✏️ Fully Customizable Inputs: Adjust all critical parameters (yellow cells) such as WACC, growth %, and tax rates.
- 📊 Professional DCF Valuation: Built-in formulas calculate Tivic’s intrinsic value using the Discounted Cash Flow method.
- ⚡ Instant Results: Visualize Tivic’s valuation instantly after making changes.
- Scenario Analysis: Test and compare outcomes for various financial assumptions side-by-side.
How It Works
- Step 1: Download the Excel file.
- Step 2: Review Tivic Health Systems, Inc.'s pre-filled financial data and projections.
- Step 3: Adjust key inputs such as revenue growth, WACC, and tax rates (highlighted cells).
- Step 4: Observe the DCF model refresh instantly as you modify your assumptions.
- Step 5: Evaluate the outputs and leverage the results for your investment strategies.
Why Choose Tivic Health Systems, Inc. (TIVC)?
- Innovative Solutions: Cutting-edge technology designed to enhance health outcomes.
- Proven Effectiveness: Backed by research and clinical trials that demonstrate efficacy.
- Patient-Centric Approach: Focused on improving the quality of life for patients through advanced products.
- Expert Support: Access to knowledgeable professionals who can assist with product implementation.
- Industry Recognition: Trusted by healthcare providers and recognized for excellence in the field.
Who Should Use Tivic Health Systems, Inc. (TIVC)?
- Healthcare Professionals: Explore innovative treatment options and integrate them into patient care.
- Researchers: Utilize cutting-edge data and findings in studies related to health technology.
- Investors: Assess your investment strategies and evaluate the potential of Tivic Health Systems, Inc. (TIVC).
- Industry Analysts: Enhance your analysis with a comprehensive understanding of the health tech market.
- Entrepreneurs: Discover insights into how emerging health companies like Tivic Health Systems, Inc. (TIVC) operate and grow.
What the Template Contains
- Pre-Filled DCF Model: Tivic Health Systems, Inc.'s (TIVC) financial data preloaded for immediate use.
- WACC Calculator: Detailed calculations for Weighted Average Cost of Capital tailored for Tivic Health.
- Financial Ratios: Evaluate Tivic Health's profitability, leverage, and efficiency metrics.
- Editable Inputs: Modify assumptions like growth rates, margins, and CAPEX to suit your analysis.
- Financial Statements: Access annual and quarterly reports for comprehensive evaluation.
- Interactive Dashboard: Visualize key valuation metrics and results effortlessly.
Disclaimer
All information, articles, and product details provided on this website are for general informational and educational purposes only. We do not claim any ownership over, nor do we intend to infringe upon, any trademarks, copyrights, logos, brand names, or other intellectual property mentioned or depicted on this site. Such intellectual property remains the property of its respective owners, and any references here are made solely for identification or informational purposes, without implying any affiliation, endorsement, or partnership.
We make no representations or warranties, express or implied, regarding the accuracy, completeness, or suitability of any content or products presented. Nothing on this website should be construed as legal, tax, investment, financial, medical, or other professional advice. In addition, no part of this site—including articles or product references—constitutes a solicitation, recommendation, endorsement, advertisement, or offer to buy or sell any securities, franchises, or other financial instruments, particularly in jurisdictions where such activity would be unlawful.
All content is of a general nature and may not address the specific circumstances of any individual or entity. It is not a substitute for professional advice or services. Any actions you take based on the information provided here are strictly at your own risk. You accept full responsibility for any decisions or outcomes arising from your use of this website and agree to release us from any liability in connection with your use of, or reliance upon, the content or products found herein.