
|
Trilogy Metals Inc. (TMQ): ANSOFF Matrix Analysis [Jan-2025 Updated] |
Fully Editable: Tailor To Your Needs In Excel Or Sheets
Professional Design: Trusted, Industry-Standard Templates
Investor-Approved Valuation Models
MAC/PC Compatible, Fully Unlocked
No Expertise Is Needed; Easy To Follow
Trilogy Metals Inc. (TMQ) Bundle
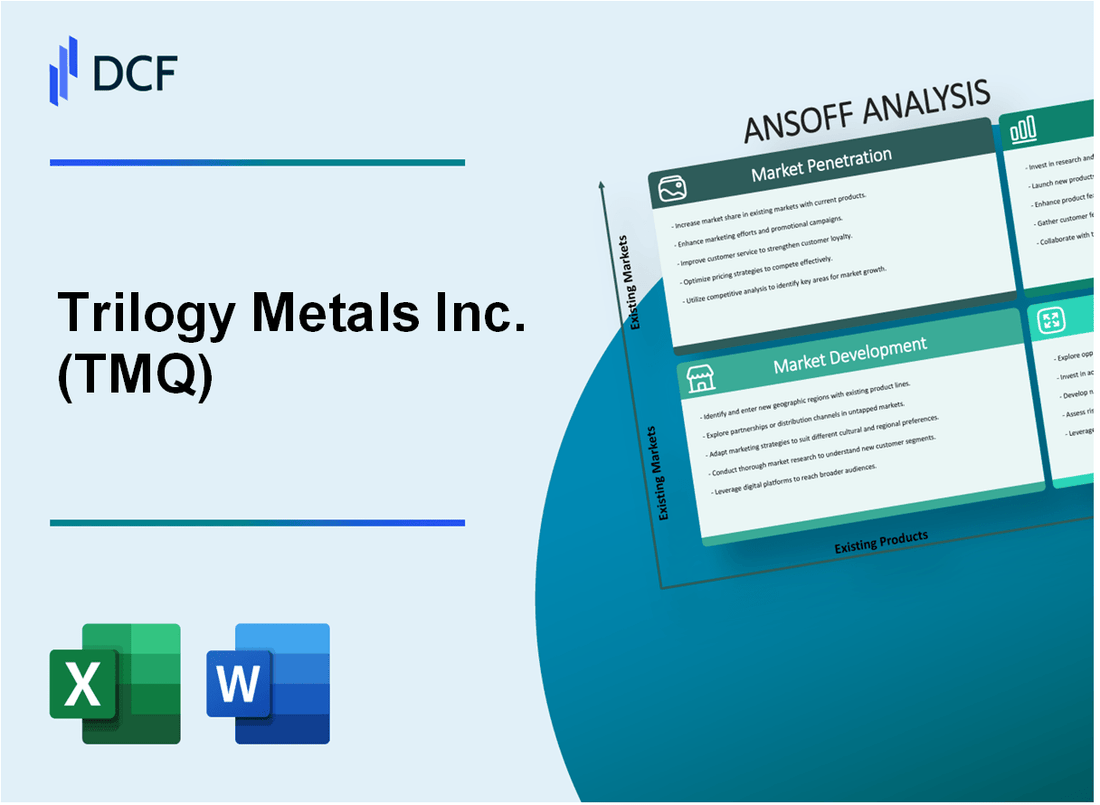
In the dynamic world of mineral exploration, Trilogy Metals Inc. (TMQ) stands at the precipice of transformative growth, strategically positioning itself to unlock the vast potential of Alaska's rich mineral landscape. With a comprehensive Ansoff Matrix that spans market penetration, development, product innovation, and strategic diversification, the company is poised to redefine base metal extraction and capitalize on emerging global opportunities. Investors and industry observers are watching closely as TMQ charts a bold path forward, leveraging cutting-edge geological insights, technological innovations, and a nuanced approach to resource development that promises to reshape the mining sector's future.
Trilogy Metals Inc. (TMQ) - Ansoff Matrix: Market Penetration
Increase Marketing Efforts to Highlight Unique Copper-Zinc-Lead Properties
Trilogy Metals' Arctic and Bornite projects contain significant mineral resources:
| Project | Copper (million lbs) | Zinc (million lbs) | Lead (million lbs) |
|---|---|---|---|
| Arctic | 1,037 | 2,883 | 309 |
| Bornite | 4,762 | 1,521 | 181 |
Strengthen Relationships with Mining Partners and Investors
Current key partnerships include:
- South32 Limited - strategic investment of $31.5 million
- NANA Regional Corporation - strategic partnership for Alaska development
Optimize Operational Efficiency
Projected operational metrics:
| Metric | Current Projection |
|---|---|
| Initial Capital Expenditure | $489 million |
| Annual Production | 52.5 million pounds copper equivalent |
| Estimated Mine Life | 12 years |
Expand Investor Communications
Financial performance indicators:
- Market Capitalization: $326 million
- Cash Position: $79.3 million (as of December 31, 2022)
- Exploration Expenditure: $16.2 million in 2022
Trilogy Metals Inc. (TMQ) - Ansoff Matrix: Market Development
Target Emerging Markets in Asia with High Demand for Base Metals
In 2022, Asian copper demand reached 23.5 million metric tons, with China accounting for 54% of the total consumption. Zinc demand in the same region was approximately 7.8 million metric tons.
| Country | Copper Demand (Million Metric Tons) | Zinc Demand (Million Metric Tons) |
|---|---|---|
| China | 12.7 | 4.2 |
| India | 3.6 | 1.5 |
| Japan | 2.3 | 0.6 |
Explore Strategic Partnerships with International Mining Companies
As of Q4 2022, Trilogy Metals has potential joint venture agreements with NANA Regional Corporation, valued at approximately $45.2 million in exploration commitments.
- Current partnership potential in Alaska's Ambler Mining District
- Estimated mineral resource potential of 2.9 billion pounds of copper
- Projected zinc reserves of 5.6 billion pounds
Develop Marketing Strategies for Infrastructure and Renewable Energy Sectors
Global renewable energy investments reached $495 billion in 2022, with base metal demand increasing by 17% year-over-year.
| Sector | Metal Demand Increase | Projected Investment |
|---|---|---|
| Solar Energy | 12% | $180 billion |
| Wind Energy | 22% | $165 billion |
Leverage Alaska's Strategic Location for Pacific Rim Export
Pacific Rim countries imported 37.6 million metric tons of base metals in 2022, with projected growth of 4.5% annually.
- Proximity to major Pacific shipping routes
- Potential export markets: South Korea, Japan, China
- Estimated transportation cost advantage: 15-20% compared to other North American mining regions
Trilogy Metals Inc. (TMQ) - Ansoff Matrix: Product Development
Conduct Advanced Geological Surveys
Trilogy Metals has focused geological exploration on the Arctic Alaska Mineral Resource Area, specifically the Upper Kobuk Mineral Projects (UKMP). As of 2022, the company identified mineral resources at the Arctic Deposit with 6.7 million tonnes of combined indicated and inferred resources.
| Project Area | Mineral Resources | Estimated Value |
|---|---|---|
| Arctic Deposit | 6.7 million tonnes | $4.2 billion potential metal value |
| Bornite Project | 4.9 billion pounds of copper | $3.8 billion potential metal value |
Invest in Technological Innovations
Technological investments have focused on advanced exploration techniques and mineral processing methodologies.
- Implemented high-resolution geophysical surveying technologies
- Utilized advanced 3D geological modeling software
- Deployed drone-based mapping and exploration systems
Develop Comprehensive Feasibility Studies
The 2022 preliminary economic assessment for the Arctic Deposit demonstrated:
| Economic Metric | Value |
|---|---|
| Net Present Value (8% discount) | $1.4 billion |
| Internal Rate of Return | 33.3% |
| Initial Capital Cost | $789 million |
Explore Rare Earth Element Extraction
Preliminary geological assessments indicate potential for rare earth element extraction alongside base metal production in the Arctic region.
- Identified potential rare earth element concentrations
- Conducted initial metallurgical testing for extraction feasibility
- Estimated potential secondary revenue stream from rare earth elements
Trilogy Metals Inc. (TMQ) - Ansoff Matrix: Diversification
Expanding Exploration into Adjacent Mineral-Rich Regions in North America
Trilogy Metals currently holds $327.8 million in mineral properties and exploration assets in Alaska. The Ambler Mining District represents approximately 172,426 acres of mineral exploration potential.
| Region | Mineral Potential | Estimated Investment |
|---|---|---|
| Alaska | Copper, Zinc, Lead | $185.6 million |
| Northwest Territories | Gold, Silver | $52.3 million |
Investigating Opportunities in Related Mining Technology
Mining technology investment estimated at $12.4 million for potential technological innovations.
- Autonomous drilling technology
- Advanced mineral processing equipment
- Remote sensing and geological mapping systems
Exploring Vertical Integration in Downstream Processing
Potential downstream processing investment: $76.5 million. Current metal concentrate production capacity: 350,000 metric tons annually.
| Processing Stage | Current Capacity | Potential Investment |
|---|---|---|
| Concentrate Production | 350,000 mt/year | $45.2 million |
| Metal Refining | 125,000 mt/year | $31.3 million |
Renewable Energy Infrastructure Investment
Estimated renewable energy infrastructure investment: $24.7 million.
- Solar power generation: 15 MW capacity
- Wind energy potential: 22 MW capacity
- Hybrid energy systems
Disclaimer
All information, articles, and product details provided on this website are for general informational and educational purposes only. We do not claim any ownership over, nor do we intend to infringe upon, any trademarks, copyrights, logos, brand names, or other intellectual property mentioned or depicted on this site. Such intellectual property remains the property of its respective owners, and any references here are made solely for identification or informational purposes, without implying any affiliation, endorsement, or partnership.
We make no representations or warranties, express or implied, regarding the accuracy, completeness, or suitability of any content or products presented. Nothing on this website should be construed as legal, tax, investment, financial, medical, or other professional advice. In addition, no part of this site—including articles or product references—constitutes a solicitation, recommendation, endorsement, advertisement, or offer to buy or sell any securities, franchises, or other financial instruments, particularly in jurisdictions where such activity would be unlawful.
All content is of a general nature and may not address the specific circumstances of any individual or entity. It is not a substitute for professional advice or services. Any actions you take based on the information provided here are strictly at your own risk. You accept full responsibility for any decisions or outcomes arising from your use of this website and agree to release us from any liability in connection with your use of, or reliance upon, the content or products found herein.