
|
Tejon Ranch Co. (TRC) DCF Valuation |
Fully Editable: Tailor To Your Needs In Excel Or Sheets
Professional Design: Trusted, Industry-Standard Templates
Investor-Approved Valuation Models
MAC/PC Compatible, Fully Unlocked
No Expertise Is Needed; Easy To Follow
Tejon Ranch Co. (TRC) Bundle
Whether you're an investor or analyst, this Tejon Ranch Co. (TRC) DCF Calculator is your go-to resource for accurate valuation. Preloaded with real data from Tejon Ranch Co., you can adjust forecasts and observe the effects in real-time.
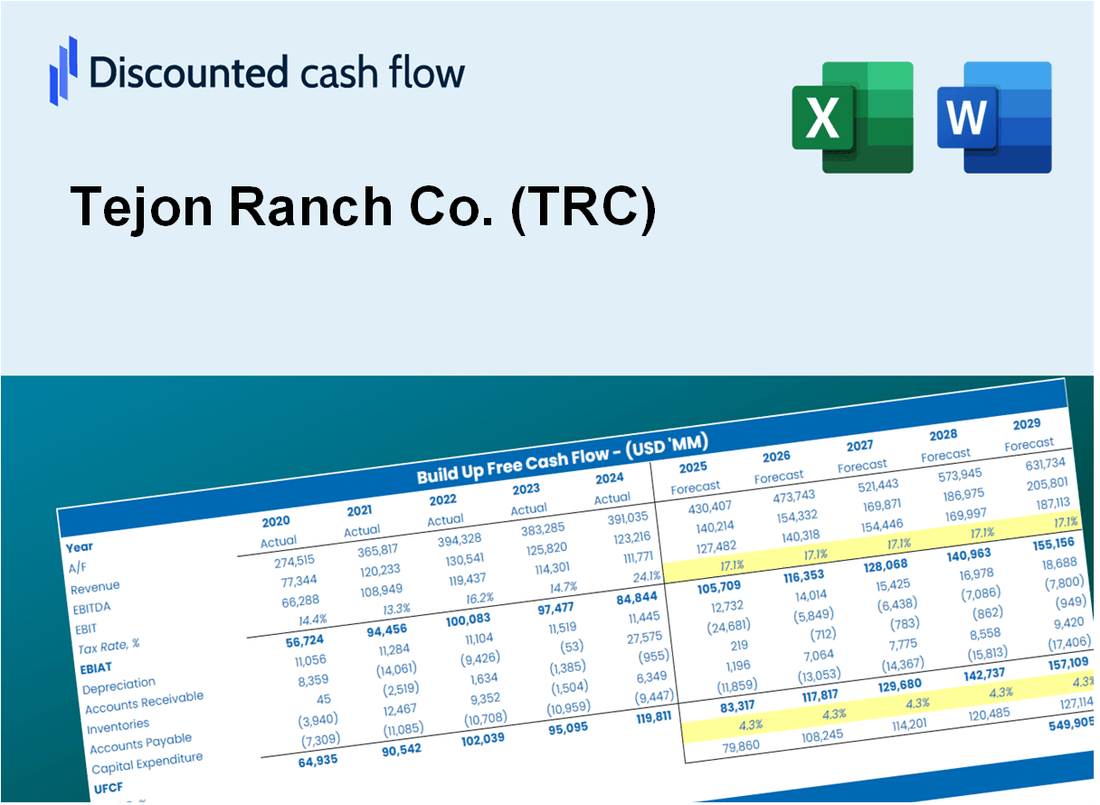
Discounted Cash Flow (DCF) - (USD MM)
| Year | AY1 2020 |
AY2 2021 |
AY3 2022 |
AY4 2023 |
AY5 2024 |
FY1 2025 |
FY2 2026 |
FY3 2027 |
FY4 2028 |
FY5 2029 |
|---|---|---|---|---|---|---|---|---|---|---|
| Revenue | 37.8 | 55.6 | 79.2 | 44.7 | 41.9 | 45.0 | 48.4 | 52.1 | 56.0 | 60.3 |
| Revenue Growth, % | 0 | 47.01 | 42.44 | -43.52 | -6.38 | 7.54 | 7.54 | 7.54 | 7.54 | 7.54 |
| EBITDA | -1.8 | 4.3 | 18.4 | 1.1 | -4.3 | 1.7 | 1.8 | 1.9 | 2.1 | 2.2 |
| EBITDA, % | -4.78 | 7.79 | 23.17 | 2.47 | -10.3 | 3.67 | 3.67 | 3.67 | 3.67 | 3.67 |
| Depreciation | 4.9 | 4.6 | 4.6 | 4.8 | 4.9 | 4.5 | 4.8 | 5.2 | 5.6 | 6.0 |
| Depreciation, % | 13.05 | 8.26 | 5.84 | 10.74 | 11.66 | 9.91 | 9.91 | 9.91 | 9.91 | 9.91 |
| EBIT | -6.7 | -.3 | 13.7 | -3.7 | -9.2 | -2.8 | -3.0 | -3.3 | -3.5 | -3.8 |
| EBIT, % | -17.84 | -0.46752 | 17.33 | -8.27 | -21.96 | -6.24 | -6.24 | -6.24 | -6.24 | -6.24 |
| Total Cash | 58.1 | 47.2 | 72.6 | 64.5 | 53.7 | 42.9 | 46.2 | 49.6 | 53.4 | 57.4 |
| Total Cash, percent | .0 | .0 | .0 | .0 | .0 | .0 | .0 | .0 | .0 | .0 |
| Account Receivables | 4.6 | 6.5 | 4.5 | 8.4 | 7.9 | 6.0 | 6.5 | 7.0 | 7.5 | 8.1 |
| Account Receivables, % | 12.14 | 11.64 | 5.62 | 18.67 | 18.9 | 13.39 | 13.39 | 13.39 | 13.39 | 13.39 |
| Inventories | 3.0 | 5.7 | 3.4 | 3.5 | 4.0 | 3.6 | 3.8 | 4.1 | 4.4 | 4.8 |
| Inventories, % | 7.9 | 10.25 | 4.25 | 7.81 | 9.48 | 7.94 | 7.94 | 7.94 | 7.94 | 7.94 |
| Accounts Payable | 3.4 | 4.5 | 5.1 | 6.5 | 9.1 | 5.4 | 5.8 | 6.2 | 6.7 | 7.2 |
| Accounts Payable, % | 8.9 | 8.17 | 6.46 | 14.43 | 21.69 | 11.93 | 11.93 | 11.93 | 11.93 | 11.93 |
| Capital Expenditure | -25.8 | -23.3 | -23.6 | -27.4 | -66.1 | -27.1 | -29.2 | -31.4 | -33.7 | -36.3 |
| Capital Expenditure, % | -68.27 | -41.89 | -29.78 | -61.16 | -157.83 | -60.22 | -60.22 | -60.22 | -60.22 | -60.22 |
| Tax Rate, % | 26.58 | 26.58 | 26.58 | 26.58 | 26.58 | 26.58 | 26.58 | 26.58 | 26.58 | 26.58 |
| EBITAT | 60.9 | -.2 | 9.4 | -2.2 | -6.8 | -1.5 | -1.6 | -1.7 | -1.8 | -1.9 |
| Depreciation | ||||||||||
| Changes in Account Receivables | ||||||||||
| Changes in Inventories | ||||||||||
| Changes in Accounts Payable | ||||||||||
| Capital Expenditure | ||||||||||
| UFCF | 35.8 | -22.3 | -4.7 | -27.4 | -65.4 | -25.5 | -26.3 | -28.2 | -30.4 | -32.7 |
| WACC, % | 5.91 | 6.2 | 6.24 | 6.2 | 6.27 | 6.16 | 6.16 | 6.16 | 6.16 | 6.16 |
| PV UFCF | ||||||||||
| SUM PV UFCF | -119.1 | |||||||||
| Long Term Growth Rate, % | 4.00 | |||||||||
| Free cash flow (T + 1) | -34 | |||||||||
| Terminal Value | -1,570 | |||||||||
| Present Terminal Value | -1,165 | |||||||||
| Enterprise Value | -1,284 | |||||||||
| Net Debt | 28 | |||||||||
| Equity Value | -1,311 | |||||||||
| Diluted Shares Outstanding, MM | 27 | |||||||||
| Equity Value Per Share | -48.89 |
What You Will Receive
- Pre-Filled Financial Model: Tejon Ranch Co.'s actual data allows for accurate DCF valuation.
- Comprehensive Forecast Control: Modify revenue growth, profit margins, WACC, and other essential metrics.
- Real-Time Calculations: Automatic updates provide immediate feedback as you adjust inputs.
- Investor-Ready Template: A polished Excel file crafted for high-quality valuation presentations.
- Customizable and Reusable: Designed for adaptability, enabling repeated use for in-depth forecasts.
Key Features
- Customizable Financial Assumptions: Adjust essential inputs such as land development rates, operational costs, and revenue projections.
- Instant DCF Valuation: Quickly derives intrinsic value, NPV, and other key metrics with ease.
- High-Precision Analytics: Leverages Tejon Ranch Co.'s (TRC) actual financial data for accurate valuation results.
- Effortless Scenario Testing: Explore various assumptions and evaluate results without complications.
- Efficiency Booster: Remove the hassle of constructing intricate valuation models from the ground up.
How It Works
- Step 1: Download the Excel file.
- Step 2: Review pre-entered Tejon Ranch Co. (TRC) data (historical and projected).
- Step 3: Adjust key assumptions (yellow cells) based on your analysis.
- Step 4: View automatic recalculations for Tejon Ranch Co. (TRC)’s intrinsic value.
- Step 5: Use the outputs for investment decisions or reporting.
Why Choose This Calculator for Tejon Ranch Co. (TRC)?
- Designed for Experts: A sophisticated tool utilized by financial analysts, investors, and real estate consultants.
- Accurate Market Data: Tejon Ranch's historical and projected financials integrated for reliable insights.
- Flexible Scenario Analysis: Effortlessly test various forecasts and assumptions to gauge potential outcomes.
- Comprehensive Results: Instantly computes intrinsic value, NPV, and essential financial metrics.
- User-Friendly Interface: Clear, step-by-step guidance ensures a smooth calculation experience.
Who Should Use This Product?
- Individual Investors: Make informed decisions about buying or selling Tejon Ranch Co. (TRC) stock.
- Financial Analysts: Streamline valuation processes with ready-to-use financial models for Tejon Ranch Co. (TRC).
- Consultants: Deliver professional valuation insights on Tejon Ranch Co. (TRC) to clients quickly and accurately.
- Business Owners: Understand how companies like Tejon Ranch Co. (TRC) are valued to guide your own strategy.
- Finance Students: Learn valuation techniques using real-world data and scenarios related to Tejon Ranch Co. (TRC).
What the Template Contains
- Historical Data: Includes Tejon Ranch Co.'s (TRC) past financials and baseline forecasts.
- DCF and Levered DCF Models: Detailed templates to calculate Tejon Ranch Co.'s (TRC) intrinsic value.
- WACC Sheet: Pre-built calculations for Weighted Average Cost of Capital.
- Editable Inputs: Modify key drivers like growth rates, EBITDA %, and CAPEX assumptions.
- Quarterly and Annual Statements: A complete breakdown of Tejon Ranch Co.'s (TRC) financials.
- Interactive Dashboard: Visualize valuation results and projections dynamically.
Disclaimer
All information, articles, and product details provided on this website are for general informational and educational purposes only. We do not claim any ownership over, nor do we intend to infringe upon, any trademarks, copyrights, logos, brand names, or other intellectual property mentioned or depicted on this site. Such intellectual property remains the property of its respective owners, and any references here are made solely for identification or informational purposes, without implying any affiliation, endorsement, or partnership.
We make no representations or warranties, express or implied, regarding the accuracy, completeness, or suitability of any content or products presented. Nothing on this website should be construed as legal, tax, investment, financial, medical, or other professional advice. In addition, no part of this site—including articles or product references—constitutes a solicitation, recommendation, endorsement, advertisement, or offer to buy or sell any securities, franchises, or other financial instruments, particularly in jurisdictions where such activity would be unlawful.
All content is of a general nature and may not address the specific circumstances of any individual or entity. It is not a substitute for professional advice or services. Any actions you take based on the information provided here are strictly at your own risk. You accept full responsibility for any decisions or outcomes arising from your use of this website and agree to release us from any liability in connection with your use of, or reliance upon, the content or products found herein.