
|
Triveni Turbine Limited (TRITURBINE.NS) DCF Valuation |
Fully Editable: Tailor To Your Needs In Excel Or Sheets
Professional Design: Trusted, Industry-Standard Templates
Investor-Approved Valuation Models
MAC/PC Compatible, Fully Unlocked
No Expertise Is Needed; Easy To Follow
Triveni Turbine Limited (TRITURBINE.NS) Bundle
Discover the true potential of Triveni Turbine Limited with our professional-grade DCF Calculator! Adjust key assumptions, explore various scenarios, and examine how changes affect Triveni Turbine Limited's valuation – all in one convenient Excel template.
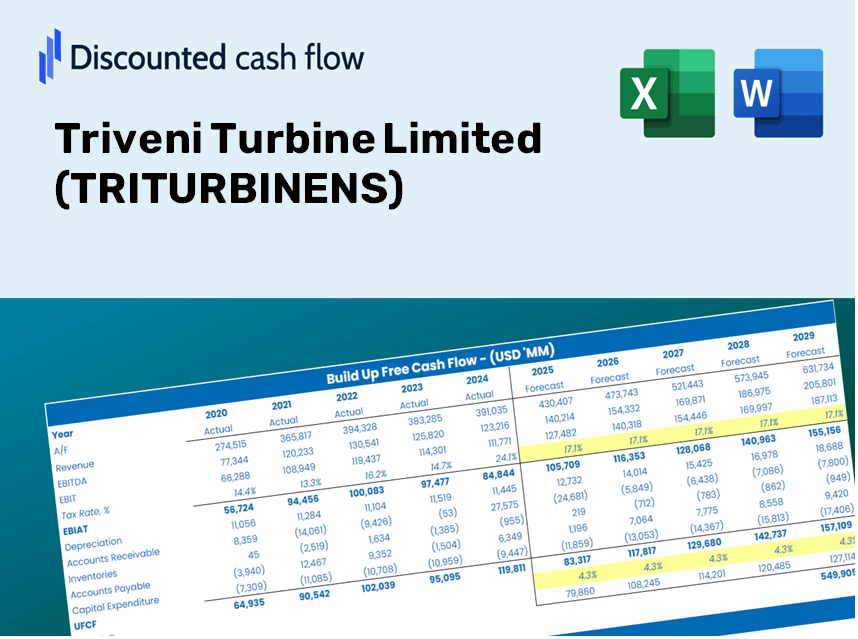
Discounted Cash Flow (DCF) - (USD MM)
| Year | AY1 2021 |
AY2 2022 |
AY3 2023 |
AY4 2024 |
AY5 2025 |
FY1 2026 |
FY2 2027 |
FY3 2028 |
FY4 2029 |
FY5 2030 |
|---|---|---|---|---|---|---|---|---|---|---|
| Revenue | 6,956.0 | 8,413.4 | 12,375.1 | 16,439.5 | 20,058.0 | 24,380.3 | 29,523.7 | 35,621.3 | 42,823.7 | 51,300.5 |
| Revenue Growth, % | 0 | 20.95 | 47.09 | 32.84 | 22.01 | 21.55 | 21.1 | 20.65 | 20.22 | 19.79 |
| EBITDA | 1,498.6 | 3,921.8 | 2,779.3 | 3,835.4 | 5,178.0 | 6,814.9 | 8,252.6 | 9,957.1 | 11,970.4 | 14,339.9 |
| EBITDA, % | 21.54 | 46.61 | 22.46 | 23.33 | 25.82 | 27.95 | 27.95 | 27.95 | 27.95 | 27.95 |
| Depreciation | 202.1 | 202.8 | 199.0 | 207.5 | 263.0 | 463.1 | 560.8 | 676.6 | 813.4 | 974.4 |
| Depreciation, % | 2.91 | 2.41 | 1.61 | 1.26 | 1.31 | 1.9 | 1.9 | 1.9 | 1.9 | 1.9 |
| EBIT | 1,296.6 | 3,719.0 | 2,580.4 | 3,627.9 | 4,915.0 | 6,351.9 | 7,691.9 | 9,280.5 | 11,156.9 | 13,365.4 |
| EBIT, % | 18.64 | 44.2 | 20.85 | 22.07 | 24.5 | 26.05 | 26.05 | 26.05 | 26.05 | 26.05 |
| Total Cash | 3,843.7 | 7,506.1 | 6,642.6 | 8,581.0 | 6,717.0 | 13,840.0 | 16,759.8 | 20,221.2 | 24,309.9 | 29,121.9 |
| Total Cash, percent | .0 | .0 | .0 | .0 | .0 | .0 | .0 | .0 | .0 | .0 |
| Account Receivables | 1,032.3 | 1,327.3 | 1,588.5 | 2,229.9 | 3,632.0 | 4,518.9 | 5,597.8 | 6,904.6 | 8,480.9 | 10,374.4 |
| Account Receivables, % | 14.84 | 15.78 | 12.84 | 13.56 | 18.11 | 18.53 | 18.96 | 19.38 | 19.8 | 20.22 |
| Inventories | 1,660.7 | 1,754.9 | 2,169.2 | 2,417.9 | 1,948.0 | 4,226.7 | 5,118.3 | 6,175.4 | 7,424.1 | 8,893.7 |
| Inventories, % | 23.87 | 20.86 | 17.53 | 14.71 | 9.71 | 17.34 | 17.34 | 17.34 | 17.34 | 17.34 |
| Accounts Payable | 744.9 | 1,090.6 | 1,143.4 | 1,745.6 | 3,417.0 | 4,395.4 | 5,612.4 | 7,116.8 | 8,965.9 | 11,226.2 |
| Accounts Payable, % | 10.71 | 12.96 | 9.24 | 10.62 | 17.04 | 18.03 | 19.01 | 19.98 | 20.94 | 21.88 |
| Capital Expenditure | -134.5 | -157.0 | -385.7 | -316.9 | -429.0 | -535.5 | -648.4 | -782.3 | -940.5 | -1,126.7 |
| Capital Expenditure, % | -1.93 | -1.87 | -3.12 | -1.93 | -2.14 | -2.2 | -2.2 | -2.2 | -2.2 | -2.2 |
| Tax Rate, % | 26.89 | 26.89 | 26.89 | 26.89 | 26.89 | 26.89 | 26.89 | 26.89 | 26.89 | 26.89 |
| EBITAT | 1,005.7 | 2,754.5 | 1,944.6 | 2,730.3 | 3,593.2 | 4,768.5 | 5,774.5 | 6,967.1 | 8,375.8 | 10,033.8 |
| Depreciation | ||||||||||
| Changes in Account Receivables | ||||||||||
| Changes in Inventories | ||||||||||
| Changes in Accounts Payable | ||||||||||
| Capital Expenditure | ||||||||||
| UFCF | -874.7 | 2,756.9 | 1,135.1 | 2,333.1 | 4,166.5 | 2,509.0 | 4,933.3 | 6,001.9 | 7,272.9 | 8,778.7 |
| WACC, % | 4.67 | 4.67 | 4.67 | 4.67 | 4.67 | 4.67 | 4.67 | 4.67 | 4.67 | 4.67 |
| PV UFCF | ||||||||||
| SUM PV UFCF | 25,180.1 | |||||||||
| Long Term Growth Rate, % | 4.00 | |||||||||
| Free cash flow (T + 1) | 9,130 | |||||||||
| Terminal Value | 1,361,741 | |||||||||
| Present Terminal Value | 1,083,862 | |||||||||
| Enterprise Value | 1,109,042 | |||||||||
| Net Debt | -2,874 | |||||||||
| Equity Value | 1,111,916 | |||||||||
| Diluted Shares Outstanding, MM | 317 | |||||||||
| Equity Value Per Share | 3,511.31 |
Your Benefits
- Comprehensive TRITURBINENS Financial Data: Access both historical and projected figures for precise valuation.
- Customizable Parameters: Adjust WACC, tax rates, revenue growth, and capital expenditures to fit your analysis.
- Dynamic Calculations: Automatically derive intrinsic value and NPV in real-time.
- Scenario Evaluation: Explore various scenarios to assess the future potential of Triveni Turbine Limited.
- User-Friendly Interface: Designed for industry experts but easy to navigate for newcomers.
Key Features
- Comprehensive DCF Calculator: Offers detailed unlevered and levered DCF valuation models tailored for Triveni Turbine Limited (TRITURBINENS).
- WACC Calculator: Ready-to-use Weighted Average Cost of Capital sheet with adjustable inputs specific to TRITURBINENS.
- Customizable Forecast Parameters: Adjust growth rates, capital investments, and discount rates as needed.
- Integrated Financial Ratios: Evaluate profitability, leverage, and efficiency ratios for Triveni Turbine Limited (TRITURBINENS).
- Visual Dashboard and Charts: Graphical outputs that highlight essential valuation metrics for straightforward analysis.
How It Works
- Step 1: Download the Excel spreadsheet.
- Step 2: Review the pre-filled data for Triveni Turbine Limited (TRITURBINENS), including historical and forecasted figures.
- Step 3: Modify the key assumptions (highlighted in yellow) based on your analysis.
- Step 4: Observe the automatic recalculations of Triveni’s intrinsic value.
- Step 5: Utilize the results for your investment strategies or reporting needs.
Why Choose This Calculator for Triveni Turbine Limited (TRITURBINENS)?
- User-Friendly Interface: Perfectly crafted for both novices and seasoned users.
- Customizable Inputs: Effortlessly adjust parameters to suit your specific analysis needs.
- Real-Time Updates: Observe immediate changes to Triveni’s valuation as you modify inputs.
- Preloaded Data: Comes equipped with Triveni’s current financial metrics for swift evaluations.
- Relied Upon by Experts: A go-to tool for investors and analysts in making strategic decisions.
Who Can Benefit from This Product?
- Individual Investors: Make well-informed choices regarding the purchase or sale of Triveni Turbine Limited (TRITURBINENS) stock.
- Financial Analysts: Enhance valuation workflows with comprehensive financial models tailored for Triveni Turbine Limited.
- Consultants: Provide accurate and timely valuation insights to clients concerning Triveni Turbine Limited.
- Business Owners: Gain an understanding of how major firms like Triveni Turbine Limited are valued to inform your business strategies.
- Finance Students: Explore valuation methodologies through the analysis of real-world data and case studies related to Triveni Turbine Limited.
Contents of the Template
- Pre-Filled DCF Model: Triveni Turbine Limited’s financial data ready for immediate utilization.
- WACC Calculator: Comprehensive calculations for the Weighted Average Cost of Capital.
- Financial Ratios: Assess Triveni's profitability, leverage, and operational efficiency.
- Editable Inputs: Modify assumptions such as growth rates, profit margins, and capital expenditures to suit your analysis.
- Financial Statements: Annual and quarterly reports available for in-depth examination.
- Interactive Dashboard: Effortlessly visualize essential valuation metrics and outcomes.
Disclaimer
All information, articles, and product details provided on this website are for general informational and educational purposes only. We do not claim any ownership over, nor do we intend to infringe upon, any trademarks, copyrights, logos, brand names, or other intellectual property mentioned or depicted on this site. Such intellectual property remains the property of its respective owners, and any references here are made solely for identification or informational purposes, without implying any affiliation, endorsement, or partnership.
We make no representations or warranties, express or implied, regarding the accuracy, completeness, or suitability of any content or products presented. Nothing on this website should be construed as legal, tax, investment, financial, medical, or other professional advice. In addition, no part of this site—including articles or product references—constitutes a solicitation, recommendation, endorsement, advertisement, or offer to buy or sell any securities, franchises, or other financial instruments, particularly in jurisdictions where such activity would be unlawful.
All content is of a general nature and may not address the specific circumstances of any individual or entity. It is not a substitute for professional advice or services. Any actions you take based on the information provided here are strictly at your own risk. You accept full responsibility for any decisions or outcomes arising from your use of this website and agree to release us from any liability in connection with your use of, or reliance upon, the content or products found herein.