
|
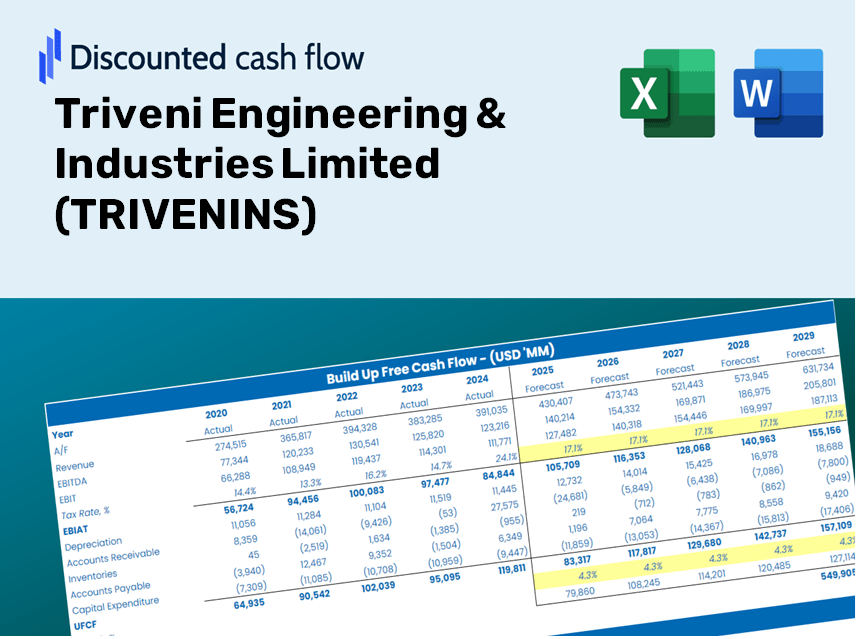
Triveni Engineering & Industries Limited (TRIVENI.NS) DCF Valuation |
Fully Editable: Tailor To Your Needs In Excel Or Sheets
Professional Design: Trusted, Industry-Standard Templates
Investor-Approved Valuation Models
MAC/PC Compatible, Fully Unlocked
No Expertise Is Needed; Easy To Follow
Triveni Engineering & Industries Limited (TRIVENI.NS) Bundle
Discover the true worth of Triveni Engineering & Industries Limited (TRIVENINS) with our advanced DCF Calculator! Adjust essential assumptions, explore various scenarios, and evaluate how different factors influence the valuation of Triveni Engineering & Industries Limited (TRIVENINS) – all within one comprehensive Excel template.
What You'll Receive
- Authentic TRIVENINS Financials: Access historical and projected data for precise valuation.
- Customizable Inputs: Adjust WACC, tax rates, revenue growth, and capital expenditure settings.
- Automated Calculations: Intrinsic value and NPV are computed in real-time.
- Scenario Analysis: Explore various scenarios to assess Triveni’s future performance.
- User-Friendly Design: Crafted for professionals, yet easy to navigate for newcomers.
Key Features
- Customizable Forecast Inputs: Adjust essential parameters such as revenue growth, EBITDA percentage, and capital expenditures.
- Instant DCF Valuation: Automatically computes intrinsic value, NPV, and other financial metrics in real-time.
- Industry-Leading Accuracy: Leverages Triveni Engineering & Industries Limited's (TRIVENINS) actual financial data for reliable valuation results.
- Simplified Scenario Analysis: Effortlessly evaluate various assumptions and analyze their impacts.
- Efficiency Booster: Avoid the hassle of constructing intricate valuation models from the ground up.
How It Works
- Download: Obtain the pre-configured Excel file containing Triveni Engineering & Industries Limited’s (TRIVENINS) financial data.
- Customize: Modify key forecasts such as revenue growth, EBITDA %, and WACC to fit your analysis.
- Update Automatically: Enjoy real-time updates for intrinsic value and NPV calculations as you adjust inputs.
- Test Scenarios: Generate various projections and instantly compare the results to assess different strategies.
- Make Decisions: Leverage the valuation insights to inform your investment approach.
Why Choose the TRIVENINS Calculator?
- Reliable Data: Access to genuine financials of Triveni Engineering & Industries Limited ensures trustworthy valuation outcomes.
- Fully Customizable: Modify essential variables such as growth rates, WACC, and tax rates to align with your forecasts.
- Efficient: Predefined calculations save you the hassle of starting from the beginning.
- Expert-Level Tool: Tailored for investors, analysts, and industry consultants.
- Easy to Use: A straightforward design and comprehensive instructions allow users of all experience levels to navigate with ease.
Who Can Benefit from This Product?
- Investors: Evaluate Triveni Engineering & Industries Limited's (TRIVENINS) valuation before making stock transactions.
- CFOs and Financial Analysts: Enhance valuation workflows and validate forecasts.
- Startup Founders: Understand how leading companies like Triveni Engineering are appraised.
- Consultants: Create in-depth valuation reports for your clients.
- Students and Educators: Utilize real-time data to practice and instruct on valuation methodologies.
What the Template Contains
- Historical Data: Comprehensive insights into Triveni Engineering & Industries Limited's (TRIVENINS) past financial performance and baseline forecasts.
- DCF and Levered DCF Models: In-depth templates designed to assess the intrinsic value of Triveni Engineering & Industries Limited (TRIVENINS).
- WACC Sheet: Ready-to-use calculations for the Weighted Average Cost of Capital.
- Editable Inputs: Customize essential drivers such as growth rates, EBITDA percentages, and CAPEX assumptions.
- Quarterly and Annual Statements: A thorough analysis of Triveni Engineering & Industries Limited's (TRIVENINS) financial statements.
- Interactive Dashboard: Dynamically visualize valuation results and future projections.
Disclaimer
All information, articles, and product details provided on this website are for general informational and educational purposes only. We do not claim any ownership over, nor do we intend to infringe upon, any trademarks, copyrights, logos, brand names, or other intellectual property mentioned or depicted on this site. Such intellectual property remains the property of its respective owners, and any references here are made solely for identification or informational purposes, without implying any affiliation, endorsement, or partnership.
We make no representations or warranties, express or implied, regarding the accuracy, completeness, or suitability of any content or products presented. Nothing on this website should be construed as legal, tax, investment, financial, medical, or other professional advice. In addition, no part of this site—including articles or product references—constitutes a solicitation, recommendation, endorsement, advertisement, or offer to buy or sell any securities, franchises, or other financial instruments, particularly in jurisdictions where such activity would be unlawful.
All content is of a general nature and may not address the specific circumstances of any individual or entity. It is not a substitute for professional advice or services. Any actions you take based on the information provided here are strictly at your own risk. You accept full responsibility for any decisions or outcomes arising from your use of this website and agree to release us from any liability in connection with your use of, or reliance upon, the content or products found herein.