
|
Trinity Industries, Inc. (TRN) DCF Valuation |
Fully Editable: Tailor To Your Needs In Excel Or Sheets
Professional Design: Trusted, Industry-Standard Templates
Investor-Approved Valuation Models
MAC/PC Compatible, Fully Unlocked
No Expertise Is Needed; Easy To Follow
Trinity Industries, Inc. (TRN) Bundle
Evaluate Trinity Industries, Inc. (TRN) financial outlook like an expert! This (TRN) DCF Calculator provides pre-filled financials and full flexibility to modify revenue growth, WACC, margins, and other essential assumptions to align with your projections.
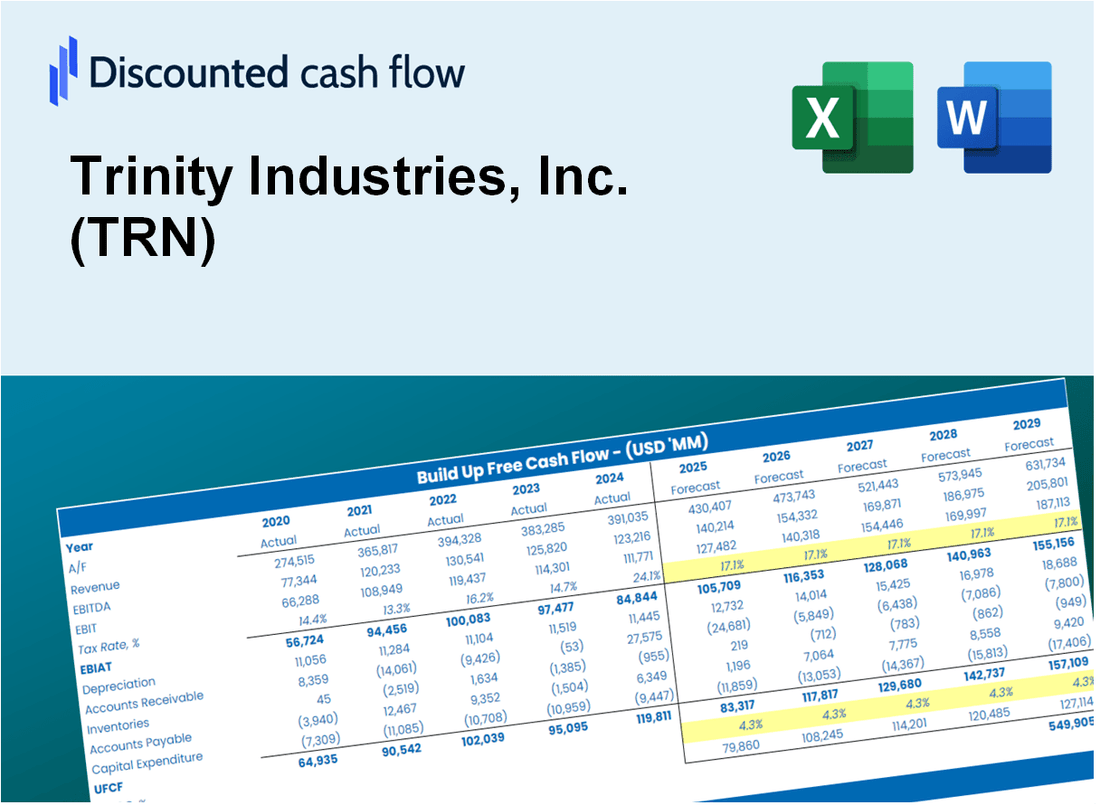
Discounted Cash Flow (DCF) - (USD MM)
| Year | AY1 2020 |
AY2 2021 |
AY3 2022 |
AY4 2023 |
AY5 2024 |
FY1 2025 |
FY2 2026 |
FY3 2027 |
FY4 2028 |
FY5 2029 |
|---|---|---|---|---|---|---|---|---|---|---|
| Revenue | 1,999.4 | 1,516.0 | 1,977.3 | 2,983.3 | 3,079.2 | 3,543.7 | 4,078.3 | 4,693.6 | 5,401.6 | 6,216.5 |
| Revenue Growth, % | 0 | -24.18 | 30.43 | 50.88 | 3.21 | 15.09 | 15.09 | 15.09 | 15.09 | 15.09 |
| EBITDA | -68.3 | 439.9 | 458.0 | 707.7 | 789.1 | 695.4 | 800.3 | 921.0 | 1,059.9 | 1,219.8 |
| EBITDA, % | -3.42 | 29.02 | 23.16 | 23.72 | 25.63 | 19.62 | 19.62 | 19.62 | 19.62 | 19.62 |
| Depreciation | 258.5 | 265.7 | 276.4 | 293.2 | 293.8 | 452.2 | 520.4 | 598.9 | 689.3 | 793.3 |
| Depreciation, % | 12.93 | 17.53 | 13.98 | 9.83 | 9.54 | 12.76 | 12.76 | 12.76 | 12.76 | 12.76 |
| EBIT | -326.8 | 174.2 | 181.6 | 414.5 | 495.3 | 243.2 | 279.9 | 322.1 | 370.7 | 426.6 |
| EBIT, % | -16.34 | 11.49 | 9.18 | 13.89 | 16.09 | 6.86 | 6.86 | 6.86 | 6.86 | 6.86 |
| Total Cash | 132.0 | 167.3 | 79.6 | 105.7 | 228.2 | 231.2 | 266.0 | 306.2 | 352.4 | 405.5 |
| Total Cash, percent | .0 | .0 | .0 | .0 | .0 | .0 | .0 | .0 | .0 | .0 |
| Account Receivables | 610.2 | 233.0 | 331.3 | 368.7 | 381.5 | 619.4 | 712.8 | 820.4 | 944.1 | 1,086.6 |
| Account Receivables, % | 30.52 | 15.37 | 16.76 | 12.36 | 12.39 | 17.48 | 17.48 | 17.48 | 17.48 | 17.48 |
| Inventories | 321.2 | 432.9 | 629.4 | 684.3 | 476.2 | 814.0 | 936.8 | 1,078.2 | 1,240.8 | 1,428.0 |
| Inventories, % | 16.06 | 28.56 | 31.83 | 22.94 | 15.47 | 22.97 | 22.97 | 22.97 | 22.97 | 22.97 |
| Accounts Payable | 146.1 | 206.4 | 287.5 | 305.3 | 251.7 | 381.8 | 439.4 | 505.7 | 582.0 | 669.8 |
| Accounts Payable, % | 7.31 | 13.61 | 14.54 | 10.23 | 8.17 | 10.77 | 10.77 | 10.77 | 10.77 | 10.77 |
| Capital Expenditure | -704.5 | -570.8 | -966.8 | -710.1 | -595.7 | -1,168.9 | -1,345.3 | -1,548.2 | -1,781.8 | -2,050.6 |
| Capital Expenditure, % | -35.24 | -37.65 | -48.89 | -23.8 | -19.35 | -32.99 | -32.99 | -32.99 | -32.99 | -32.99 |
| Tax Rate, % | 37.6 | 37.6 | 37.6 | 37.6 | 37.6 | 37.6 | 37.6 | 37.6 | 37.6 | 37.6 |
| EBITAT | -149.4 | 124.0 | 142.0 | 294.9 | 309.1 | 159.8 | 183.9 | 211.7 | 243.6 | 280.4 |
| Depreciation | ||||||||||
| Changes in Account Receivables | ||||||||||
| Changes in Inventories | ||||||||||
| Changes in Accounts Payable | ||||||||||
| Capital Expenditure | ||||||||||
| UFCF | -1,380.7 | 144.7 | -762.1 | -196.5 | 148.9 | -1,002.5 | -799.6 | -920.2 | -1,059.0 | -1,218.8 |
| WACC, % | 4.52 | 5.41 | 5.66 | 5.41 | 5.11 | 5.22 | 5.22 | 5.22 | 5.22 | 5.22 |
| PV UFCF | ||||||||||
| SUM PV UFCF | -4,273.5 | |||||||||
| Long Term Growth Rate, % | 3.50 | |||||||||
| Free cash flow (T + 1) | -1,261 | |||||||||
| Terminal Value | -73,219 | |||||||||
| Present Terminal Value | -56,764 | |||||||||
| Enterprise Value | -61,037 | |||||||||
| Net Debt | 5,463 | |||||||||
| Equity Value | -66,500 | |||||||||
| Diluted Shares Outstanding, MM | 84 | |||||||||
| Equity Value Per Share | -789.79 |
What You Will Receive
- Authentic TRN Financial Data: Pre-populated with Trinity Industries' historical and projected figures for accurate assessment.
- Completely Customizable Template: Easily adjust critical inputs such as revenue growth, WACC, and EBITDA %.
- Instant Calculations: Watch Trinity Industries' intrinsic value refresh immediately based on your modifications.
- Expert Valuation Tool: Crafted for investors, analysts, and consultants aiming for precise DCF outcomes.
- Intuitive Interface: Streamlined layout and straightforward instructions suitable for all skill levels.
Key Features
- Comprehensive Financial Data: Trinity Industries' historical financial statements and projected forecasts.
- Customizable Parameters: Modify WACC, tax rates, revenue growth, and EBITDA margins as needed.
- Real-Time Valuation: Observe Trinity Industries' intrinsic value update instantly.
- Intuitive Visualizations: Dashboard graphs present valuation outcomes and essential metrics clearly.
- Designed for Precision: A reliable tool tailored for analysts, investors, and finance professionals.
How It Works
- Step 1: Download the prebuilt Excel template featuring Trinity Industries, Inc. (TRN) data.
- Step 2: Review the pre-filled sheets to familiarize yourself with the key performance indicators.
- Step 3: Modify forecasts and assumptions in the editable yellow cells (WACC, growth, margins).
- Step 4: Instantly see the recalculated results, including the intrinsic value of Trinity Industries, Inc. (TRN).
- Step 5: Utilize the outputs to make informed investment decisions or create comprehensive reports.
Why Choose This Calculator for Trinity Industries, Inc. (TRN)?
- Designed for Experts: A sophisticated tool utilized by analysts, CFOs, and industry consultants.
- Accurate Financial Data: Trinity’s historical and projected financials are preloaded for precise analysis.
- Flexible Scenario Analysis: Effortlessly simulate various forecasts and assumptions.
- Comprehensive Outputs: Instantly calculates intrinsic value, NPV, and essential metrics.
- User-Friendly: Step-by-step guidance ensures a smooth calculation process.
Who Should Use This Product?
- Professional Investors: Create comprehensive and accurate valuation models for assessing Trinity Industries, Inc. (TRN).
- Corporate Finance Teams: Evaluate valuation scenarios to inform strategic decisions within the organization.
- Consultants and Advisors: Deliver precise valuation insights for clients interested in Trinity Industries, Inc. (TRN).
- Students and Educators: Utilize real-world data to enhance learning and practice in financial modeling.
- Industry Analysts: Gain insights into how transportation and logistics companies like Trinity Industries, Inc. (TRN) are valued in the market.
What the Template Contains
- Pre-Filled Data: Contains Trinity Industries’ historical financials and projections.
- Discounted Cash Flow Model: Editable DCF valuation model featuring automatic calculations.
- Weighted Average Cost of Capital (WACC): A dedicated sheet for calculating WACC based on tailored inputs.
- Key Financial Ratios: Assess Trinity Industries’ profitability, efficiency, and leverage.
- Customizable Inputs: Easily modify revenue growth, margins, and tax rates.
- Clear Dashboard: Visuals and tables summarizing essential valuation outcomes.
Disclaimer
All information, articles, and product details provided on this website are for general informational and educational purposes only. We do not claim any ownership over, nor do we intend to infringe upon, any trademarks, copyrights, logos, brand names, or other intellectual property mentioned or depicted on this site. Such intellectual property remains the property of its respective owners, and any references here are made solely for identification or informational purposes, without implying any affiliation, endorsement, or partnership.
We make no representations or warranties, express or implied, regarding the accuracy, completeness, or suitability of any content or products presented. Nothing on this website should be construed as legal, tax, investment, financial, medical, or other professional advice. In addition, no part of this site—including articles or product references—constitutes a solicitation, recommendation, endorsement, advertisement, or offer to buy or sell any securities, franchises, or other financial instruments, particularly in jurisdictions where such activity would be unlawful.
All content is of a general nature and may not address the specific circumstances of any individual or entity. It is not a substitute for professional advice or services. Any actions you take based on the information provided here are strictly at your own risk. You accept full responsibility for any decisions or outcomes arising from your use of this website and agree to release us from any liability in connection with your use of, or reliance upon, the content or products found herein.