
|
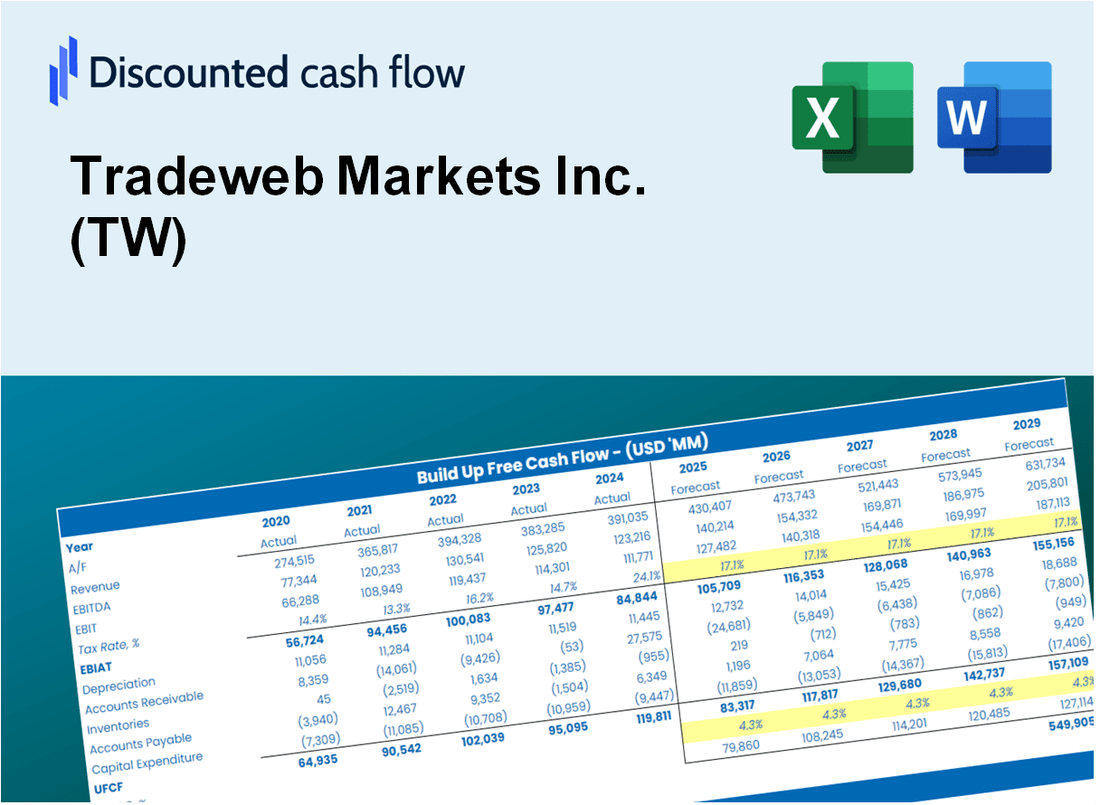
Tradeweb Markets Inc. (TW) DCF Valuation |
Fully Editable: Tailor To Your Needs In Excel Or Sheets
Professional Design: Trusted, Industry-Standard Templates
Investor-Approved Valuation Models
MAC/PC Compatible, Fully Unlocked
No Expertise Is Needed; Easy To Follow
Tradeweb Markets Inc. (TW) Bundle
Optimize your time and improve precision with our (TW) DCF Calculator! Utilizing real Tradeweb Markets Inc. data and customizable assumptions, this tool empowers you to forecast, analyze, and value (TW) like a seasoned investor.
Discounted Cash Flow (DCF) - (USD MM)
| Year | AY1 2020 |
AY2 2021 |
AY3 2022 |
AY4 2023 |
AY5 2024 |
FY1 2025 |
FY2 2026 |
FY3 2027 |
FY4 2028 |
FY5 2029 |
|---|---|---|---|---|---|---|---|---|---|---|
| Revenue | 892.7 | 1,076.4 | 1,188.8 | 1,338.2 | 1,725.9 | 2,039.1 | 2,409.0 | 2,846.1 | 3,362.4 | 3,972.4 |
| Revenue Growth, % | 0 | 20.59 | 10.44 | 12.57 | 28.97 | 18.14 | 18.14 | 18.14 | 18.14 | 18.14 |
| EBITDA | 428.6 | 542.9 | 616.0 | 733.3 | 978.7 | 1,067.5 | 1,261.2 | 1,490.0 | 1,760.3 | 2,079.7 |
| EBITDA, % | 48.01 | 50.43 | 51.82 | 54.8 | 56.7 | 52.35 | 52.35 | 52.35 | 52.35 | 52.35 |
| Depreciation | 153.8 | 171.3 | 178.9 | 185.4 | 220.0 | 305.0 | 360.3 | 425.7 | 502.9 | 594.2 |
| Depreciation, % | 17.23 | 15.91 | 15.05 | 13.85 | 12.75 | 14.96 | 14.96 | 14.96 | 14.96 | 14.96 |
| EBIT | 274.8 | 371.6 | 437.1 | 548.0 | 758.7 | 762.5 | 900.9 | 1,064.3 | 1,257.4 | 1,485.5 |
| EBIT, % | 30.78 | 34.52 | 36.77 | 40.95 | 43.96 | 37.4 | 37.4 | 37.4 | 37.4 | 37.4 |
| Total Cash | 792.3 | 973.0 | 1,258.2 | 1,707.5 | 1,341.3 | 1,863.2 | 2,201.2 | 2,600.5 | 3,072.3 | 3,629.7 |
| Total Cash, percent | .0 | .0 | .0 | .0 | .0 | .0 | .0 | .0 | .0 | .0 |
| Account Receivables | 105.7 | 129.9 | 154.3 | 549.6 | 290.1 | 386.5 | 456.6 | 539.4 | 637.3 | 752.9 |
| Account Receivables, % | 11.84 | 12.07 | 12.98 | 41.07 | 16.81 | 18.95 | 18.95 | 18.95 | 18.95 | 18.95 |
| Inventories | .0 | .0 | .0 | .0 | .0 | .0 | .0 | .0 | .0 | .0 |
| Inventories, % | 0 | 0 | 0 | 0 | 0 | 0 | 0 | 0 | 0 | 0 |
| Accounts Payable | 42.9 | 38.8 | 63.8 | 409.4 | 163.1 | 219.5 | 259.3 | 306.4 | 361.9 | 427.6 |
| Accounts Payable, % | 4.81 | 3.61 | 5.36 | 30.59 | 9.45 | 10.76 | 10.76 | 10.76 | 10.76 | 10.76 |
| Capital Expenditure | -42.5 | -51.3 | -60.1 | -18.5 | -41.0 | -74.8 | -88.4 | -104.4 | -123.4 | -145.8 |
| Capital Expenditure, % | -4.77 | -4.77 | -5.06 | -1.38 | -2.37 | -3.67 | -3.67 | -3.67 | -3.67 | -3.67 |
| Tax Rate, % | 33.52 | 33.52 | 33.52 | 33.52 | 33.52 | 33.52 | 33.52 | 33.52 | 33.52 | 33.52 |
| EBITAT | 166.5 | 227.8 | 309.3 | 364.9 | 504.4 | 496.7 | 586.9 | 693.3 | 819.1 | 967.7 |
| Depreciation | ||||||||||
| Changes in Account Receivables | ||||||||||
| Changes in Inventories | ||||||||||
| Changes in Accounts Payable | ||||||||||
| Capital Expenditure | ||||||||||
| UFCF | 215.0 | 319.4 | 428.7 | 482.0 | 696.6 | 686.9 | 828.5 | 978.8 | 1,156.4 | 1,366.2 |
| WACC, % | 7.64 | 7.64 | 7.64 | 7.64 | 7.64 | 7.64 | 7.64 | 7.64 | 7.64 | 7.64 |
| PV UFCF | ||||||||||
| SUM PV UFCF | 3,944.9 | |||||||||
| Long Term Growth Rate, % | 2.00 | |||||||||
| Free cash flow (T + 1) | 1,393 | |||||||||
| Terminal Value | 24,707 | |||||||||
| Present Terminal Value | 17,098 | |||||||||
| Enterprise Value | 21,043 | |||||||||
| Net Debt | -1,306 | |||||||||
| Equity Value | 22,349 | |||||||||
| Diluted Shares Outstanding, MM | 215 | |||||||||
| Equity Value Per Share | 103.98 |
What You Will Get
- Real TW Financials: Access to historical and projected data for precise valuation.
- Customizable Inputs: Adjust WACC, tax rates, revenue growth, and capital expenditures as needed.
- Dynamic Calculations: Intrinsic value and NPV are calculated in real-time.
- Scenario Analysis: Evaluate various scenarios to assess Tradeweb’s future performance.
- User-Friendly Design: Designed for professionals while remaining easy to use for novices.
Key Features
- Customizable Trading Parameters: Adjust essential metrics such as trade volume, transaction fees, and market volatility.
- Instant Market Analysis: Provides real-time insights and analytics for immediate decision-making.
- High-Precision Data: Leverages Tradeweb’s extensive market data for accurate trading outcomes.
- Versatile Scenario Testing: Easily assess various market conditions and their potential impacts.
- Efficiency Booster: Streamlines the trading process, reducing the need for manual calculations and models.
How It Works
- Download: Get the pre-built Excel file featuring Tradeweb Markets Inc.'s (TW) financial data.
- Customize: Modify forecasts, including trading volume, revenue growth, and operating margins.
- Update Automatically: The intrinsic value and NPV calculations refresh in real-time.
- Test Scenarios: Develop various projections and instantly compare results.
- Make Decisions: Leverage the valuation outcomes to inform your investment approach.
Why Choose Tradeweb Markets Inc. (TW) Calculator?
- All-in-One Solution: Combines DCF, WACC, and financial ratio analyses for comprehensive evaluations.
- Flexible Parameters: Modify the yellow-highlighted cells to explore different financial scenarios.
- In-Depth Analysis: Automatically computes Tradeweb's intrinsic value and Net Present Value.
- Built-In Data: Access to historical and projected data for reliable analysis.
- Expert-Level Tool: Perfect for financial analysts, investors, and business advisors.
Who Should Use This Product?
- Investors: Evaluate Tradeweb Markets Inc. (TW) to inform your buying or selling decisions.
- CFOs and Financial Analysts: Enhance valuation methodologies and validate financial forecasts.
- Startup Founders: Understand how leading financial technology firms like Tradeweb are valued.
- Consultants: Provide clients with comprehensive valuation analyses and reports.
- Students and Educators: Utilize real-time data to practice and teach financial valuation skills.
What the Template Contains
- Comprehensive DCF Model: Editable template with detailed valuation calculations tailored for Tradeweb Markets Inc. (TW).
- Real-World Data: Tradeweb’s historical and projected financials preloaded for analysis.
- Customizable Parameters: Adjust WACC, growth rates, and tax assumptions to test various scenarios.
- Financial Statements: Full annual and quarterly breakdowns for deeper insights into Tradeweb Markets Inc. (TW).
- Key Ratios: Built-in analysis for profitability, efficiency, and leverage specific to Tradeweb.
- Dashboard with Visual Outputs: Charts and tables for clear, actionable results related to Tradeweb Markets Inc. (TW).
Disclaimer
All information, articles, and product details provided on this website are for general informational and educational purposes only. We do not claim any ownership over, nor do we intend to infringe upon, any trademarks, copyrights, logos, brand names, or other intellectual property mentioned or depicted on this site. Such intellectual property remains the property of its respective owners, and any references here are made solely for identification or informational purposes, without implying any affiliation, endorsement, or partnership.
We make no representations or warranties, express or implied, regarding the accuracy, completeness, or suitability of any content or products presented. Nothing on this website should be construed as legal, tax, investment, financial, medical, or other professional advice. In addition, no part of this site—including articles or product references—constitutes a solicitation, recommendation, endorsement, advertisement, or offer to buy or sell any securities, franchises, or other financial instruments, particularly in jurisdictions where such activity would be unlawful.
All content is of a general nature and may not address the specific circumstances of any individual or entity. It is not a substitute for professional advice or services. Any actions you take based on the information provided here are strictly at your own risk. You accept full responsibility for any decisions or outcomes arising from your use of this website and agree to release us from any liability in connection with your use of, or reliance upon, the content or products found herein.